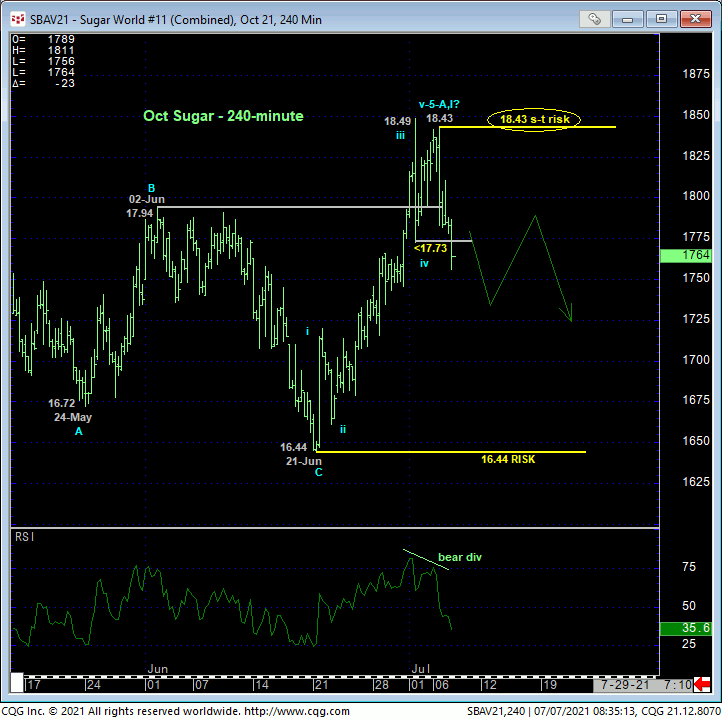
The 240-min chart below shows this morning’s failure below a minor corrective low at 17.73 from Thur’s that confirms a bearish divergence in short-term momentum. This mo failure, we believe, defines yesterday’s 18.43 high as the 5th-Wave (failure) end to a smaller-degree Elliott sequence up from 21-Jun’s 16.44 next larger-degree corrective low. Per such, we’re identifying yesterday’s 18.43 high as our new short-term risk parameter from which non-bullish decisions like long-covers and cautious bearish punts can be objectively based and managed.


Today’s admittedly shorter-term weakness may not seem like that big a deal and we certainly cannot conclude a larger-degree peak/reversal threat from such a minor display of weakness. HOWEVER, the:
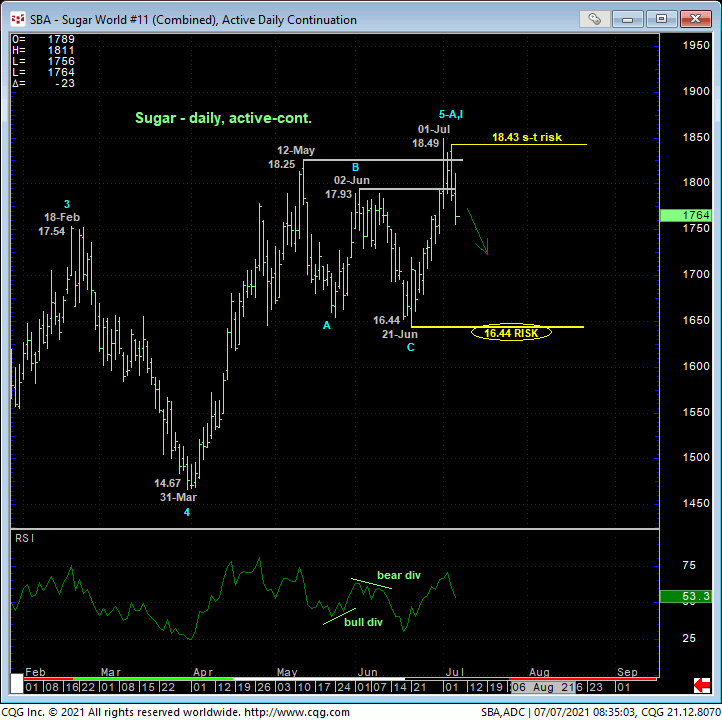
- market’s gross failure to sustain the past few days’ rally above the past TWO MONTHS’ 18.25-to-17.93-area resistance amidst
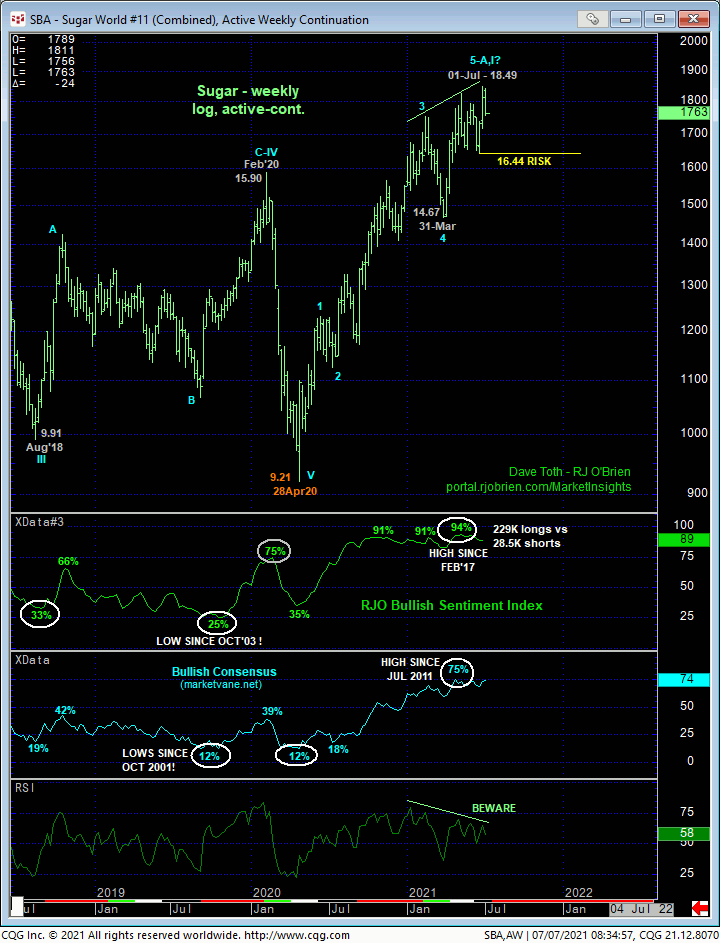
- historically frothy sentiment/contrary opinion levels not seen in at least four years and, in the case of the Bullish Consensus (marketvane.net), since 2011!
- upside momentum that has been waning all year and
- the prospect that the entire rally from Apr’20’s 9.21 low may be a complete 5-wave Elliott sequence
once again exposes a threat to the secular bull trend that could be major in scope.
IF this setback is just another corrective hiccup/whipsaw, then all the bull’s got to do is recoup yesterday’s 18.43 high and short-term risk parameter. Until and unless such strength is proven, at least a more considerable correction of the latest portion of the bull from 16.44 to 18.43 should not surprise. From a long-term perspective, 21-Jun’s 16.44 larger-degree corrective low remains intact as THE KEY long-term risk parameter, the break of which will confirm a bearish divergence in WEEKLY momentum and expose a major correction or reversal lower.
Might today’s smaller-degree momentum failure evolve into a major failure below 16.44? Who knows. This isn’t the first time recently the market has posed this correction-vs-reversal threat. It did so with mid-May’s short-term mo failure and late-Feb’s mo failure. Each of these setbacks ultimately proved to be 3-wave corrections within the still-unfolding secular bull. But we DO KNOW at this point that a recovery above 18.43 is required to negate a peak/correction/reversal count and reinstate the secular bull. Until such strength is proven, further and possibly accelerated losses, including a key break below 16.44, should not come as a surprise.

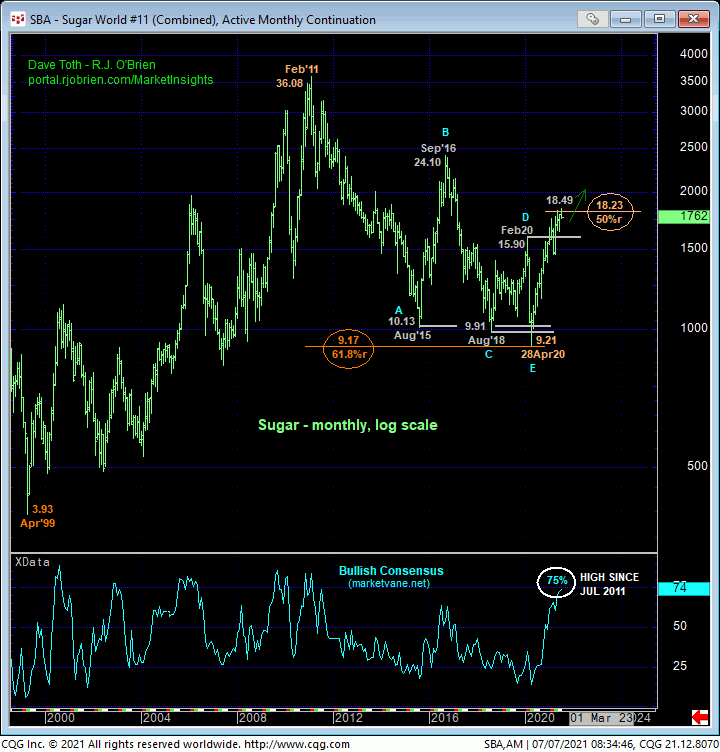
Finally, it is waaaaay premature to conclude the market’s proximity to the (18.23) 50% retrace of 2011 – 2019’s entire secular bear market decline from 36.08 to 9.21 on a monthly log scale basis below as a contributing factor to a major peak/reversal count. But commensurately larger-degree weakness below 16.44 will add this element to the peak/reversal argument.
These issues considered, shorter-term traders with tighter risk profiles are advised to neutralize bullish exposure at-the-market and first approach recovery attempts to 18.00 OB as corrective selling opportunities with a recovery above 18.43 negating this call and warranting its cover. Longer-term commercial players are advised to pare bullish exposure to more conservative levels and jettison remaining exposure on commensurately larger-degree weakness below 16.44. Longer-term players also have the option to neutralize all bullish exposure around current levels and acknowledge and accept whipsaw risk back above 18.43 for deeper nominal risk below 16.44.


