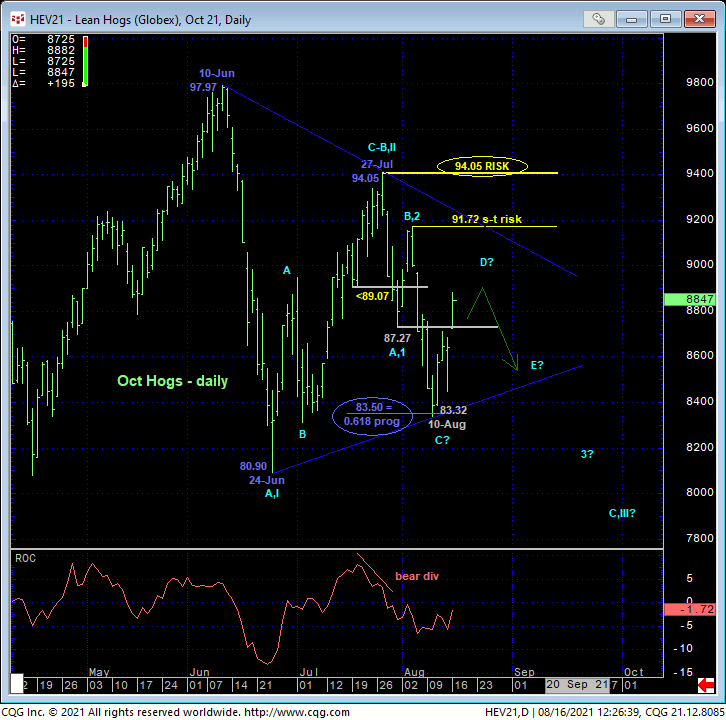
Since early-to-mid-Jun and as introduced in 17-Jun’s Technical Blog, we’ve been advocating a major peak/correction/reversal count down from 10-Jun’s 97.97 high in the now-prompt Oct contract (123.60 in the then-prompt Jul contract). The major peak/reversal-threat count was and remains predicated on:
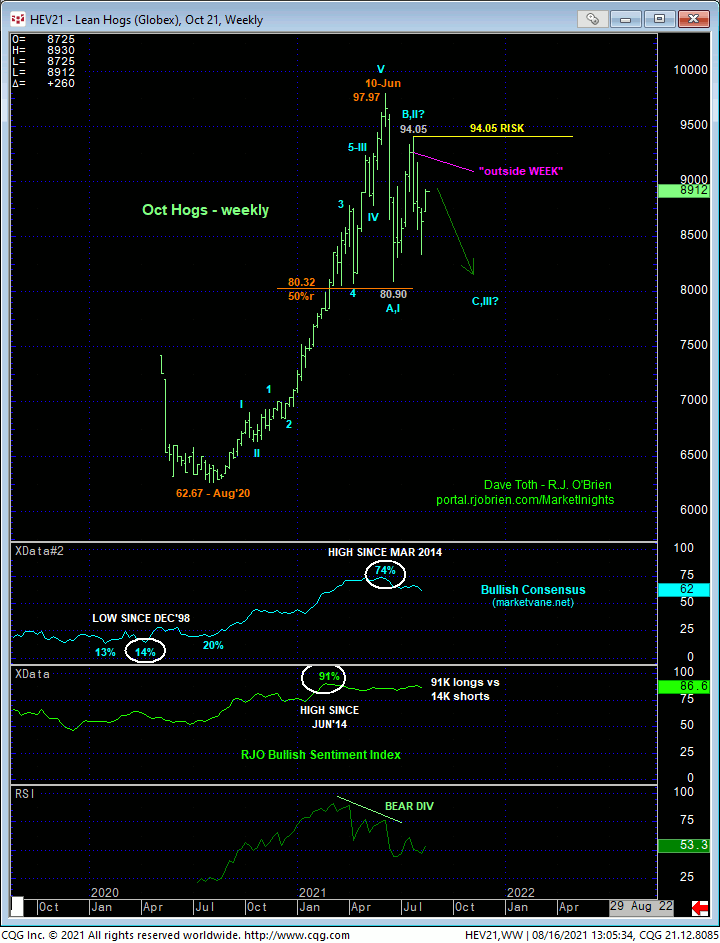
- 17-Jun’s bearish divergence in WEEKLY momentum amidst
- historically frothy sentiment/contrary opinion levels not seen since 2014
- a textbook complete 5-wave Elliott sequence up from Aug or Apr’20’s lows (depending on which contract you’re using)
- the extent and impulsiveness of Jun’s (suspected initial A- or 1st-Wave) counter-trend decline
- Jun-Jul’s 3-wave and thus (suspected B- or 2nd-Wave) corrective recovery attempt
- an “outside WEEK” the week of 27-Jul’s suspected B- or 2nd-Wave high at 94.05, and
- the fact that this market has done something other than rally in the months following Jun in every year for the past 13 years except last year.
With the exception of the past 13 years’ seasonal tendencies, these elements are by-and-large identical to the peak/correction/reversal elements in corn and beans the past few months. The reason we’re trying to make the possible connection between hogs and corn/beans stems from a bullish divergence in very short-term momentum today that, as we’ll discuss below, defines 10-Aug’s 83.32 low as one of developing importance and possibly part of a huge lateral triangle pattern that would be corrective/consolidative ahead of a resumption of the secular BULL trend.
Before drilling down to an intra-day chart, we’d like to point out in the daily chart below the Fibonacci fact that the decline from 27-Jul’s 94.05 high spanned a length just a few ticks beyond the (83.50) 0.618 progression of Jun’s preceding 97.97 – 80.90 decline. This 0.618 progression relationship between alternating moves is common for lateral diagonal triangle consolidations.

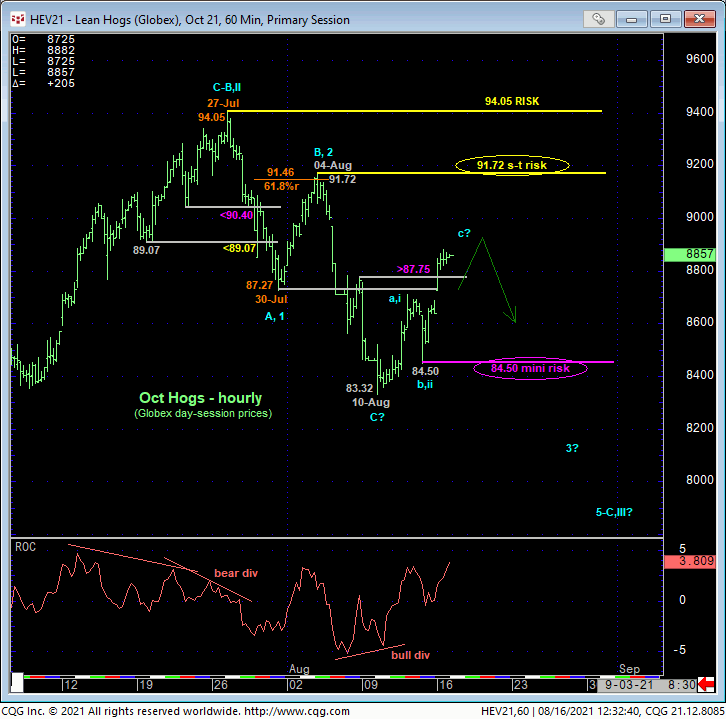
Drilling down, the hourly chart below shows today’s recovery above 06-Aug’s 87.75 minor corrective high that breaks the downtrend from 04-Aug’s 91.72 high that confirms a bullish divergence in short-term momentum. This mo failure defines Fri’s 84.50 low as the latest smaller-degree corrective low the market now needs to sustain gains above to maintain a more immediate bullish count. Its failure to do so will render the recovery from 83.32 a 3-wave and thus corrective structure consistent with our major peak/reversal count calling the decline from 27-Jul’s 94.05 high the massive 3rd-Wave of a major new trend down.
Inversely, a recovery above 04-Aug’s 91.72 low remains required to render the decline from 94.05 to 83.32 a 3-wave and this corrective structure that would tip longer-term directional scales back to the BULL side, just like what has happened recently in corn and may be happening in beans. In effect then and with the bane of aimless whipsaw risk from the middle-half bowels of a lateral range as a backdrop, we believe the market has identified 91.72 and 84.50 as the very tight but key flexion points and risk parameters around which shorter-term traders can objectively toggle directional biases and exposure.


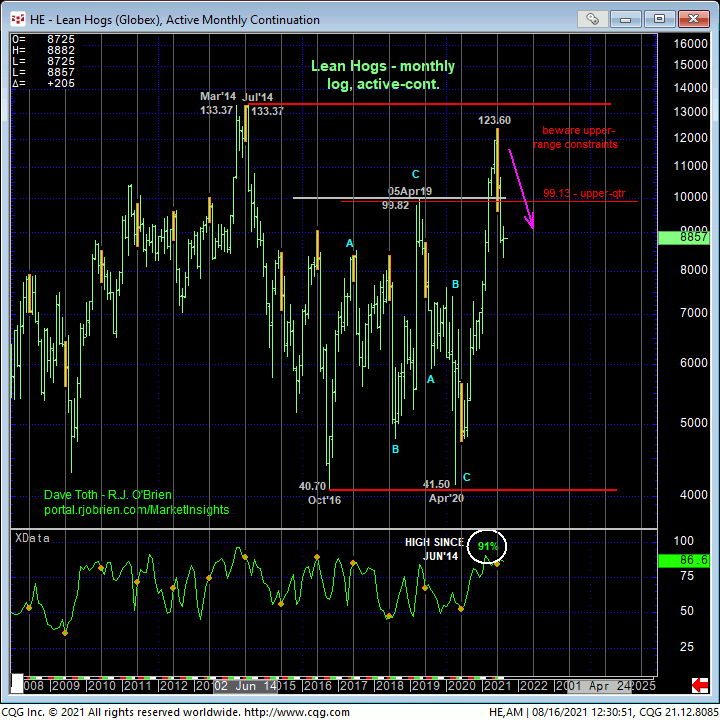
On a longer-term basis, the weekly chart of Oct hogs above and monthly log active-continuation chart below show the list of major peak/reversal-threat elements listed above that began with 17-Jun’s massive momentum failure. On such a longer-term basis, commensurately larger-degree strength above 27-Jul’s 94.05 high remains required to negate the count that contends the decline from that high is a major 3rd-Wave down. Per such, this 94.05 level remains intact as our key long-term bear risk parameter for longer-term commercial players. Interim strength above out short-term risk parameter at 91.72 will give a leg up on the bullish count while a relapse below 84.50 will reinforce the long-term bearish count.
These issues considered, a bearish policy and exposure remain advised for longer-term players with a recovery above at least 91.72 required to threaten this count and warrant paring exposure to more conservative levels with subsequent strength above 94.05 required to jettison remaining exposure altogether. Shorter-term traders with tighter risk profiles are between to key flexion points at 91.72 and 84.50 whereby a bearish policy remains OK until/unless the market recoups 91.72 OR a cautious bullish policy is OK until/unless the market fails below 84.50.


