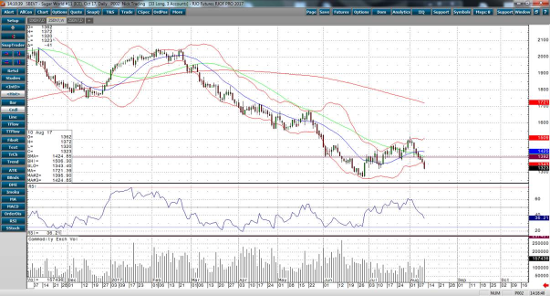
This week’s comment finds the October sugar futures demolishing a rather well defined upward sloping channel and answering all technical questions we had in our last visit. Is the market bottoming? Is this the beginning of a longer term uptrend? Will October sugar futures be able to hold and advance above the 50-day moving average? No, no and no. Global surplus and lackluster demand have conspired to trump short term technical factors and fund trader short covering. Brazilian harvest is chugging along and globally supplies of sugar should remain ample. The chart shows a sugar market fully rolling over and taking out two previous levels of support in what appears to be a bid to take out the June low, 12.74. The fund trader, who recently was on the buy side of the ledger, has decreased their net short positions by about 50k contracts in the last 30 days. As of the last reporting period that short position has been trimmed from about 112k contracts down to about 73k. My guess is the new COT report will show funds puking up those recently bought contracts and back on the short side again, likely near the 100k level. Traders with more intestinal fortitude and risk capital can continue to view the chart as a cup with handle bottom, albeit one with a very large handle, for about 49 more points until October makes new lows. As of now the oversold technical condition could lead to a bounce. The 50-day moving average, 13.95 should now be resistance. I want to be mindful of the possibility that sugar could continue to churn, moving the funds into and out of positions, but for now the chart points lower.
Oct ’17 Sugar Daily Chart


