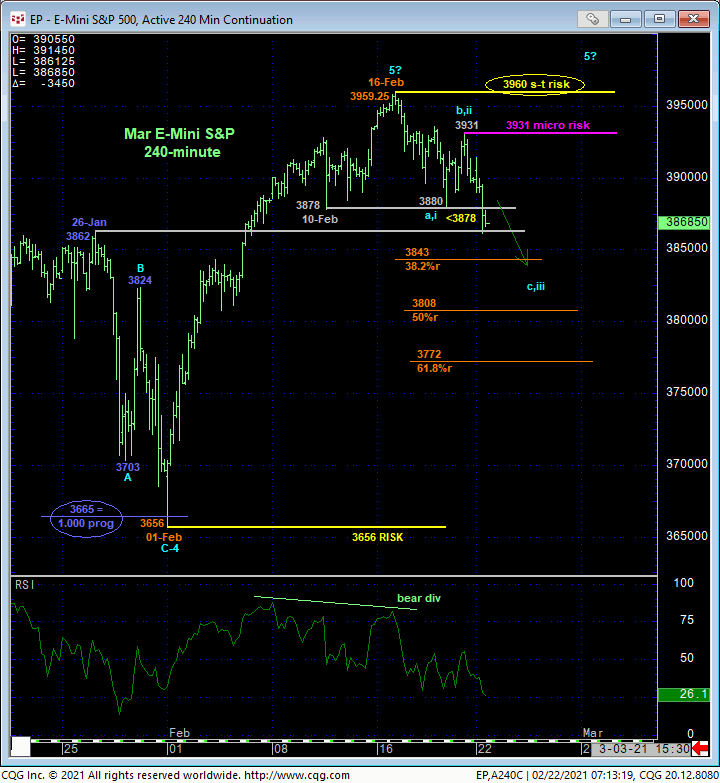
The 240-min chart below shows overnight’s break below both Thur’s 3880 initial counter-trend low and 10-Feb’s 3878 corrective low confirms a bearish divergence in short-term momentum. This momentum failure identifies 16-Feb’s 3959.25 high as THE END of the uptrend from 01-Feb’s 3656 low. Per such, we’re defining 3960 as our new short-term risk parameter from which shorter-term traders with tighter risk profiles can objectively base non-bullish decisions like long-covers and cautious bearish punts. Even smaller-degree strength above Fri’s 3931 minor corrective high would be helpful in navigating this sell-off attempt as a 3-wave and thus corrective affair consistent with the secular bull trend. Until and unless at least such 3931+ strength is proven, and especially a recovery above 3960, the extent of this suspected correction OR POSSIBLE REVERSAL is indeterminable and potentially extreme.

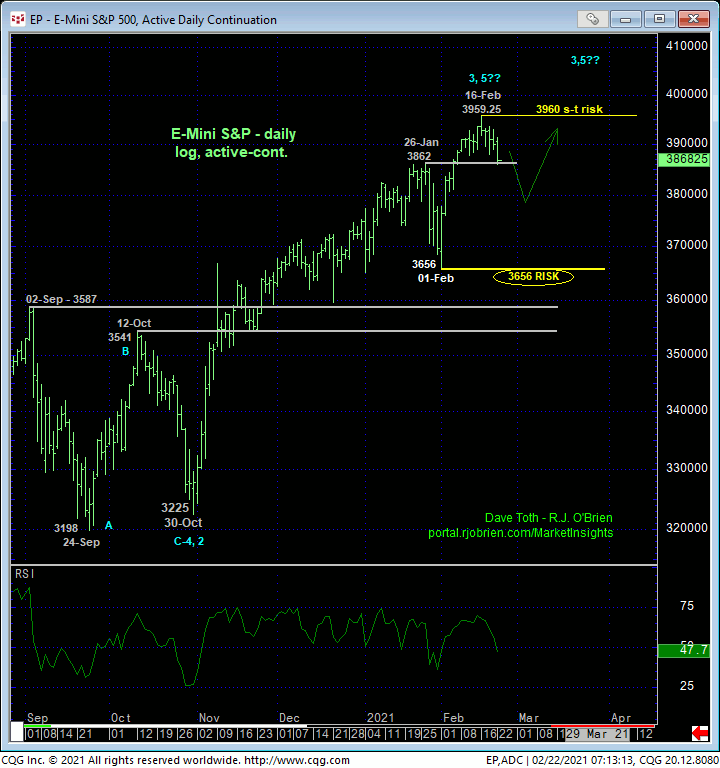
In both the 240-min chart above and daily log chart below, former 3860-area resistance is acknowledged as a new support candidate. But only a relapse-stemming bullish divergence in momentum will reject/define a more reliable low and support that we can then acknowledge as the prospective end to this correction and an objective risk parameter from which resumed bullish positions can only then be objectively rebased and managed. Until and unless such a mo failure arrests this relapse, there’s really no telling how deeply the market can drive prices.
In the 240-min chart above, we’ve marked the 38.2%, 50% and 61.8% retraces of Feb’s portion of the bull from 3656 to 3959, but these “derived” levels mean nothing in the absence of an accompanying confirmed bullish divergence in mo needed to, in fact, stem the clear and present intermediate-term downtrend.
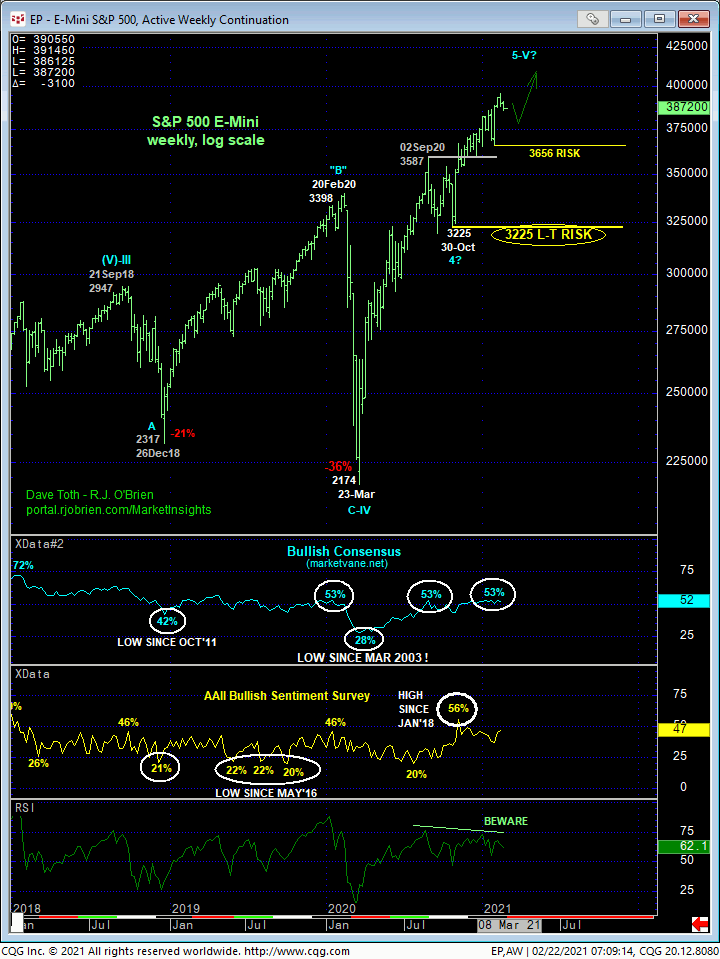
Here’s where the issue of technical and trading SCALE comes in. Clearly, the bull market has been interrupted on a shorter-term basis as a result of overnight’s bearish divergence in short-term momentum. A recovery above 3960 precisely is required to nullify this fact and reinstate the secular bull, requiring a return to a bullish policy by shorter-term traders. On a longer-term basis, it is equally clear that commensurately larger-degree weakness below 01-Feb’s 3656 next larger-degree corrective low remains required to break the uptrend from even 30_ct20’s 3225 low, let alone the secular bull market. Per such, this 3656 level remains intact as our long-term risk parameter pertinent to longer-term traders and investors. Between the just-violated 3878 level and 3656 are NO levels of any technical pertinence in the absence of a relapse-stemming bullish divergence in momentum. So if risking bullish exposure to 3656 is too much for your risk profile, there is no choice but to pare or neutralize bullish exposure here and now. This is the specific and distinct difference between shorter-term traders and longer-term investors.

Such commensurately larger-degree weakness needed to break even Oct-Feb’s uptrend is more easily seen in the weekly log chart below. On this larger-degree basis, setback attempts are advised to first be approached as corrective buying opportunities by longer-term players, with a minimum failure below 3656 required to negate this call and warrant its cover and neutralize bullish exposure from further and possibly massive weakness thereafter. Until and unless such sub-3656 weakness is proven, the secular bull market remains arguably intact and is expected to continue.

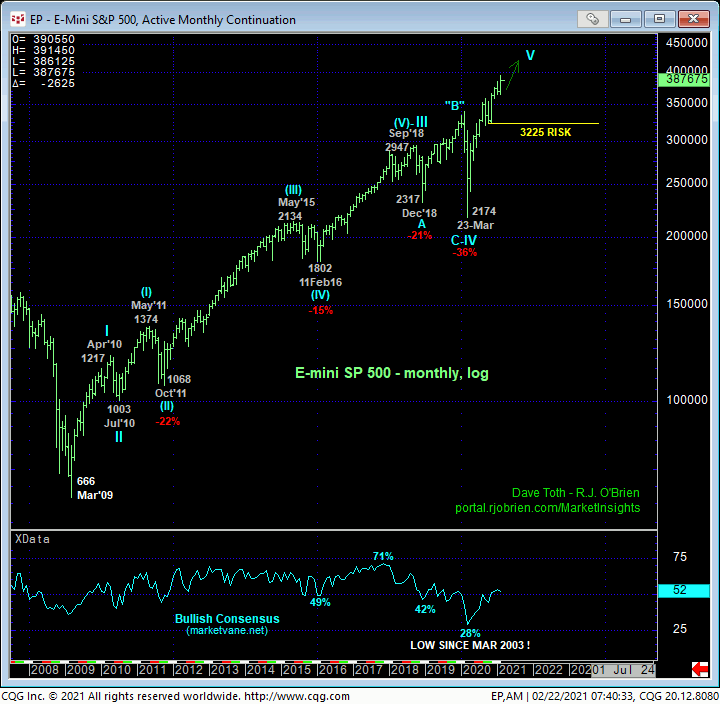
Indeed, on an even larger-degree monthly basis below, today’s bearish divergence in short-term momentum doesn’t even register. This short-term mo failure is only pertinent to shorter-term traders with tighter risk profiles that are likewise exposed to a higher risk of whipsaw risk. This just comes with the territory.
On this major, long-term scale, a failure below 30Oct20’s 3225 major corrective low remains required to break the uptrend from Mar’20’s 2174 low and possibly the secular bull market and expose a major correction or reversal lower that could be massive. But this market’s got a number of thresholds to break before we get t that point.
These issues considered, shorter-term traders with tighter risk profiles have been advised to neutralize bullish exposure to circumvent the depths unknown of a suspected correction of Feb’s 3656 – 3959 rally. A recovery above at least 3931 is required to resurrect a bullish count while a recovery above 3960 is required to reinstate the bull and warrant a return to a bullish policy. Commensurately larger-degree weakness below 3656 remains required to threaten the longer-term bullish prospects enough for longer-term players and investors to neutralize exposure. What the market has in store for us between spot and 3656 is anyone’s guess. Longer-term players have the option of paring some bullish exposure here and now and acknowledging and exchanging whipsaw risk (back above 3960) for deeper nominal risk below 3656.


