Surprisingly for some analysts, there did not appear to be any major moves on traditional safe haven options the JPY or Gold during this unusually dramatic period. April’s market activity revolved largely around a rebound from the lows in the US Indices, and the ripple effect of the large market fall, combined with the quarantine, which subsequently impacted Oil.
We have yet to see whether opening the country back up cautiously in May will have a positive impact on the markets.
There are some questions still unanswered, such as when will a COVID-19 cure and vaccine arrive, how will the unemployment change once corporations reassess the post-quarantine forecasts, and how will all this impact the upcoming US elections?
We also need to factor in that, historically with similar viruses, if there is a second wave it has generally been higher as its base is already established in portions of the population.
In the week ahead, the focus may be on the employment numbers again with the big announcement due on Friday.
Major calendar news to consider this week are:
- ISM Non-Manufacturing PMI – Tuesday.
- ADP Non-Farm Employment Change – Wednesday.
- Unemployment claims- Thursday.
- Non-Farm Employment Change – Friday.
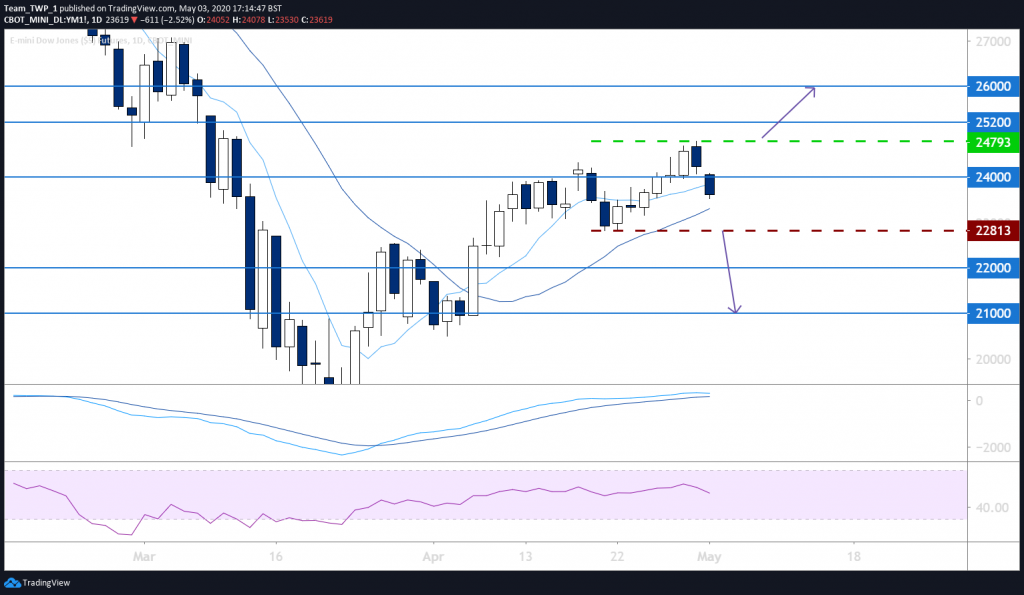
YM, Dow Jones, Daily, potentially Bearish
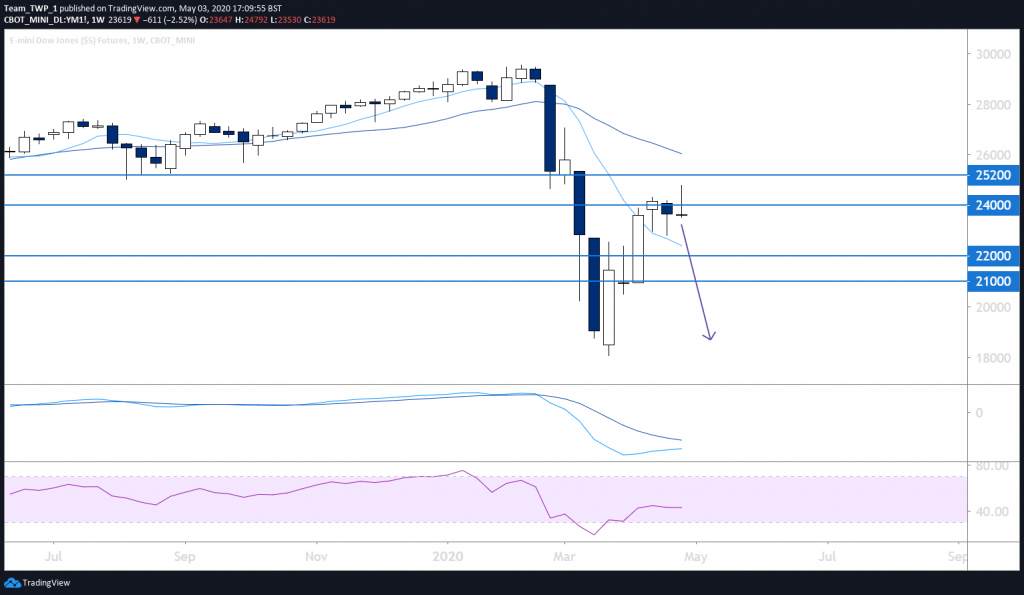
The weekly chart shows two hanging-man candles followed by a bearish rejection candle last week, against resistance at 24,000 after a relatively large move from the lows around 18,000.
Price is also in the sell-zone area between the moving averages (MAs), which can act as a point of equilibrium where direction shifts in strong trends.
Recently, the chart has not displayed any weakness. In fact, the trend to the upside has been quite determined so, aside from the three weekly candles at key resistance, there is a valid possibility that price could break lower this coming week as well as higher. But for now, the downside option appears greater.
The daily chart shows that each recent swing high has been less significant than the previous one, almost as if price is curving over. But technically it is still in an uptrend.
Should price break the recent swing low at 22,813, a move further down becomes more likely. Day traders could look for a re-test (and rejection) of this level on lower timeframes, while swing traders may find the market heads lower without a daily re-test. However, if this does generate a daily bearish candle around 22,813, that could reinforce the next move lower.
A technical stop-loss above the recent swing-high at 24,793 could be prudent, should price suddenly become reinvigorated with buyers.
In the case of a bullish candlestick forming in the current moving averages on the Daily timeframe, buyers may attempt to break 24,793 and move higher, disregarding the bearish weekly candle and thereby invalidating the bearish setup idea.
During periods of increased volatility, a reduction in standard account risk could be considered. Taking profits if the moves are in the prevailing direction may mitigate risk further.
Risk management will be key, so a stop-loss is imperative, in order to protect capital exposure against unforeseen outcomes.
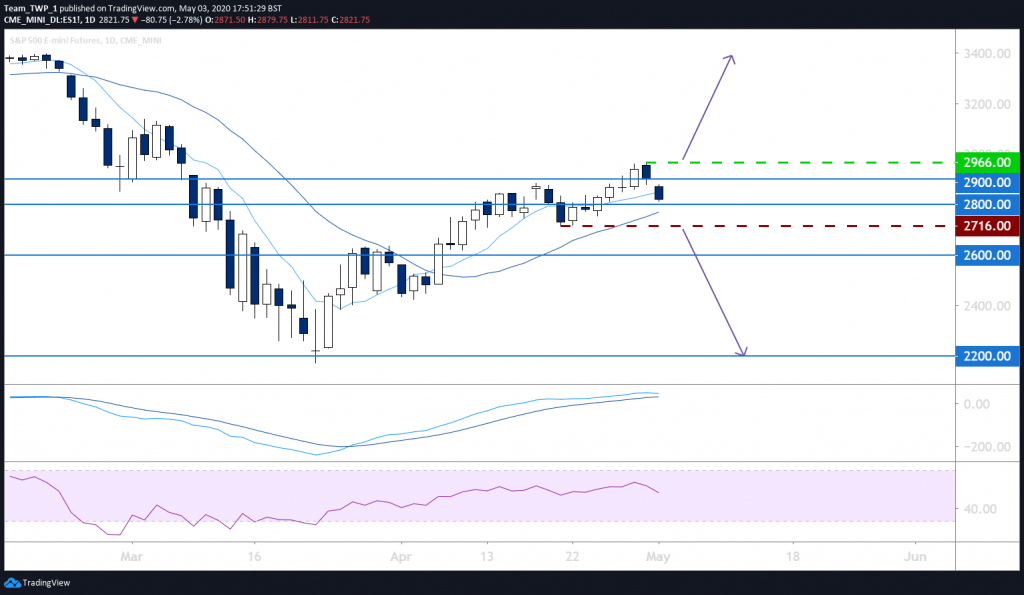
ES, S&P, Daily, potentially Bearish
An almost identical candlestick pattern has occurred across many indices, and this may represent more than one opportunity if risk is considered.
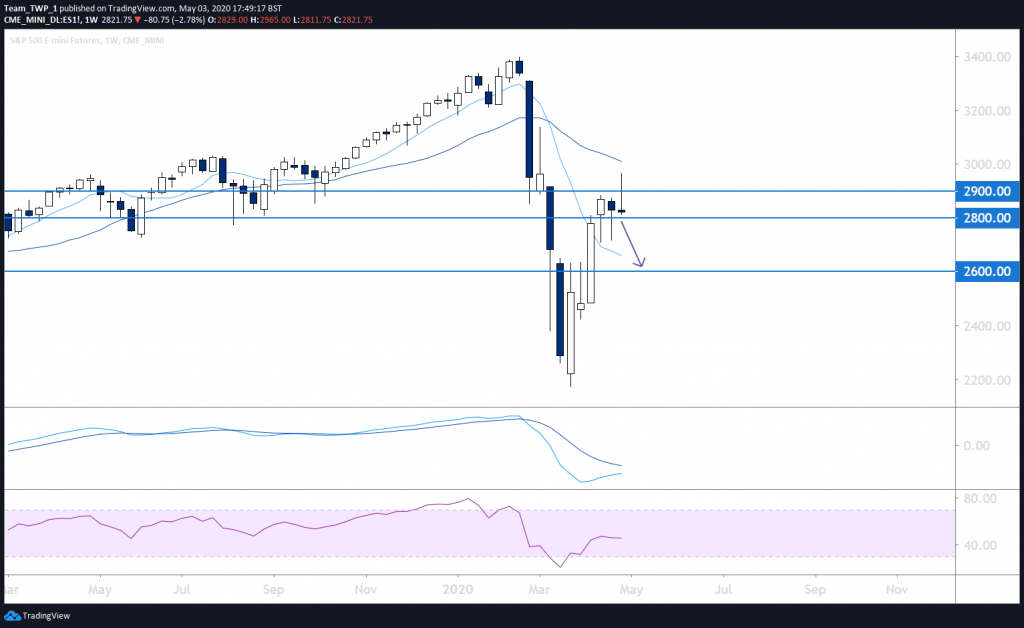
The weekly chart also shows two hanging-man candles followed by a bearish rejection candle last week, against resistance at 2,900 after a relatively large move from the lows around 2,200.
Price is again in the sell zone area between the MAs, which can act as a point of equilibrium where direction shifts in strong trends.
The momentum indicators are convergent with price on both the weekly and daily timeframes, not adding any significant sentiment.
Should price break the recent swing low at 2,716, a move further down becomes more likely. Here again, day traders could look for a retest (and rejection) of this level on lower timeframes such as the 30 minute and one hour, while swing traders may find the market heads lower without a daily re-test.
A technical stop-loss above the recent swing-high at 2,966 could be prudent should price suddenly become reinvigorated with buyers.
Note: Price action can often “bounce” significantly off important price levels and buyers place their orders there in advance. Bearish traders may consider taking profits ahead of the levels and anticipating these potential bounces.
In the case of a bullish candlestick forming in the current MAs on the daily timeframe, buyers may attempt to break 2,966 and move higher, disregarding the bearish weekly candle and thereby invalidating the bearish setup idea.
Risk management will be key, so a stop-loss is imperative, in order to protect capital exposure against unforeseen outcomes.