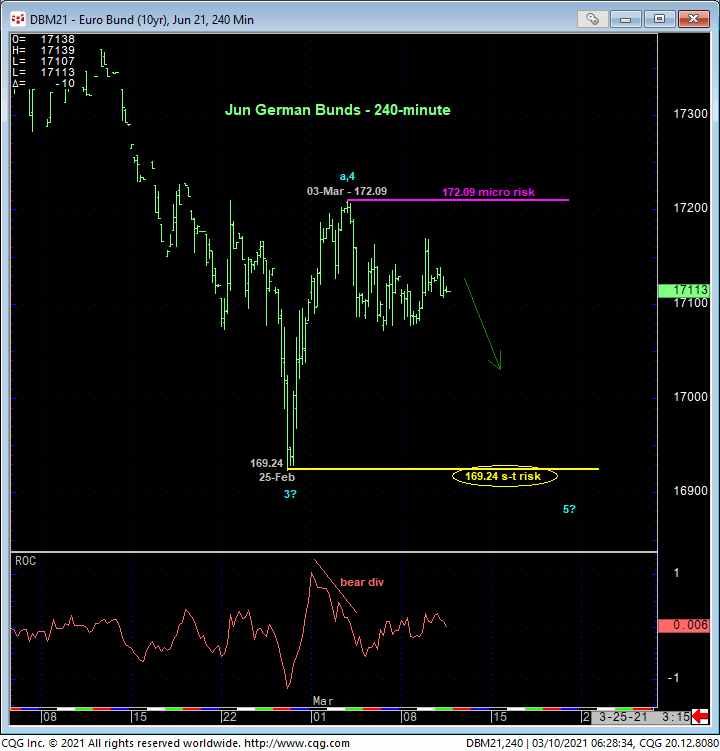
In 03-Mar’s Technical Blog we identified that day’s 174.97 high in the then-prompt Mar contract as one of developing importance following that day’s bearish divergence in short-term momentum that might have ended or defined the upper boundary of a suspected correction within a broader peak/reversal environment. The 240-min chart below shows that this rejected/defined high in the now-prompt Jun contract is 172.09. Until and unless this 172.09 high is broken, we believe this level marks the end or upper boundary of a suspected correction from 25-Feb’s 169.24 low ahead of an eventual resumption of Dec-Feb’s downtrend that preceded it. While 25-Feb’s 169.24 low remains intact as support however, it also remains intact as an objective short-term risk parameter from which non-bearish decisions like short-covers and cautious bullish punts can still be objectively based and managed. In effect then, we believe these two levels- 169.24 and 172.09- mark the key shorter-term directional flexion points heading forward.

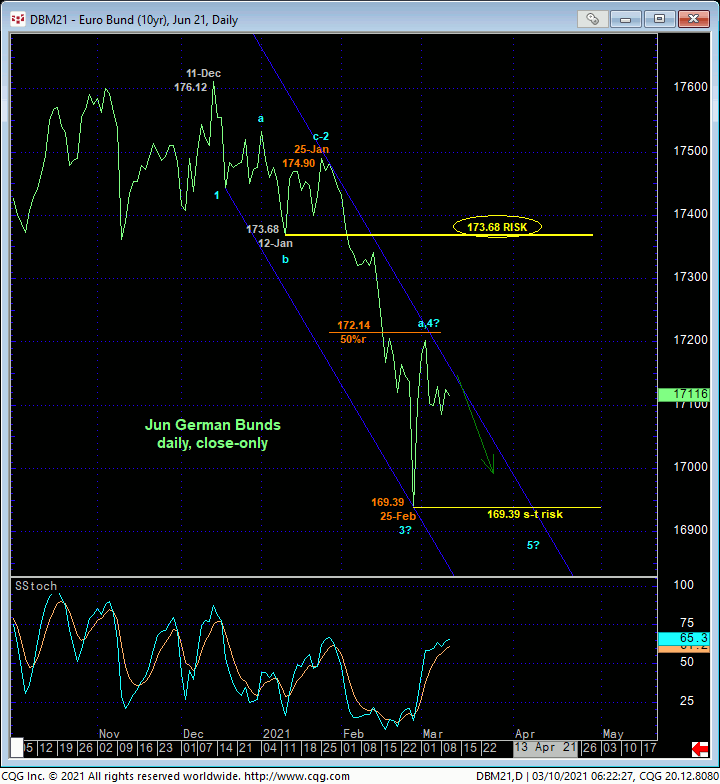
From a longer-term perspective, the extent and impulsiveness of Feb’s plunge shown in the daily close-only chart of the Jun contract below reinforces our major peak/reversal count introduced in 06-Jan’s Technical Blog. This relative collapse from 25-Jan’s 174.90 high close to 25-Feb’s 169.39 is characteristic of a 3rd-wave within an eventual 5-wave Elliott sequence down. This is our basis for first approaching the recent late-Feb/early-Mar rebound as a (4th-wave) correction ahead of an eventual (5th-wave) resumption of the broader downtrend. The market would have to recover above at least 12-Jan’s 173.68 low and former support-turned-resistance to truly jeopardize the impulsive integrity of this count. Per such and for the time being, this 173.68 level serves as our key long-term risk parameter from which longer-term institutional players are advised to base and manage the risk of a still-advised bearish policy. Following a more protracted retest of 25-Feb’s 169.24 intra-day low or certainly the break of this low, we’ll be able t trail this longer-term bear risk parameter to just above last week’s 172.09 high.

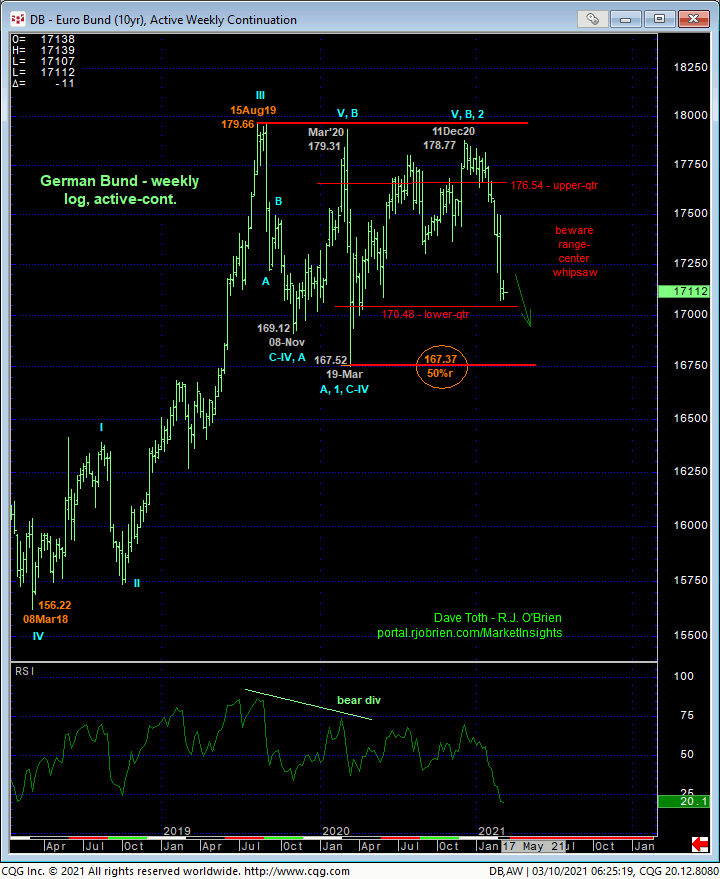
On an even broader basis, the weekly log active-continuation chart below shows the market’s approach to the lower-quarter of the range that has encapsulated this market for the past year-and-a-half and where greater keener eye is required to watch for a relapse-stemming bullish divergence in momentum that could relegate the market back to the middle-half bowels of this range for quarters to come. Until the market confirms such a bullish divergence in momentum of a scale commensurate to threaten the major decline from 11Dec20’s high, it would be premature to suggest that a massive peak/reversal environment that could blow away Mar’20’s 167.52 low isn’t underway.
These issues considered, a bearish policy remains advised for longer-term institutional players with a recovery above at least 172.09 and preferably 173.68 required to threaten or negate this call and warrant its paring or cover. Shorter-term traders remain advised to maintain a cautious bearish policy and exposure from current 171.25-area prices OB with a recovery above 172.09 required to negate this specific call and warrant its cover. In lieu of such 172.09+ strength, we anticipate lateral-to-lower prices in the period immediately ahead, including the possible resumption of our broader bearish count to new lows below 169.24.


