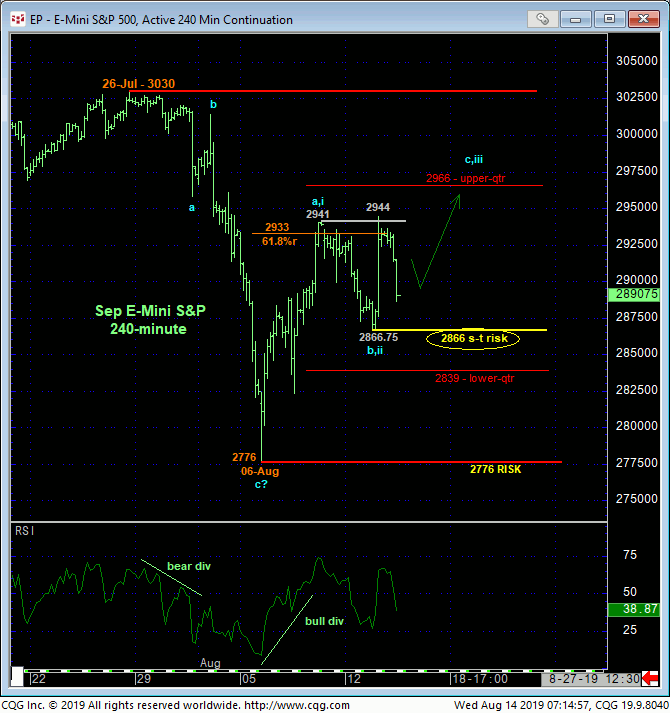
The middle-halves of ranges are always treacherous to navigate as the odds of aimless whipsaw risk are higher. Imitating directional exposure from such range-center environs is a poor risk/reward bet where a more conservative approach to risk assumption is urged. This mean either being as tight as is objectively possible n identifying a risk parameter or as loose (i.e. taking a big step back to a longer-term approach) as is objectively possible.
The 240-min chart shows this market deep within the middle-half bowels of the past few weeks’ range. Flip a coin. By virtue of yesterday’s poke above last Thur’s 2941 high, the market as identified yesterday’s 2866.75 low as the latest smaller-degree corrective low and the tightest level and risk parameter this market needs to fail below to threaten the past week’s recovery and expose the intermediate-term trend as down.
06-Aug’s 2776 low is one of obvious importance that, for reasons we’ll explain below, now serves as our new long-term risk parameter, the failure below which we believe would warrant the cover of even long-term bullish exposure.
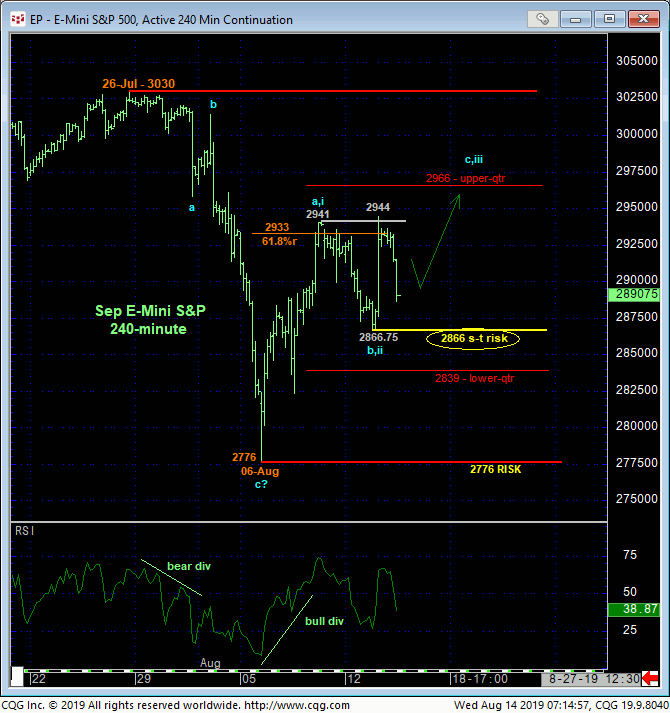
In 06-Aug’s Technical Blog into the teeth of that week’s meltdown we said:
But let’s play the devil’s advocate and conclude, prematurely, that this current headline-generating plunge IS the start of a more protracted move south that would warrant even paring or neutralizing long-term bull risk in personal IRAs and such. As we discussed is last Oct’s equally excitable plunge, the market typically does not make it easy for bears by sustaining such “obvious” weakness and vulnerability too early in a peak/reversal process. Rather, following such an “initial” countertrend plunge that has many heading for the exits, the market will typically produce an often-times extensive corrective rebuttal before the REAL bad bear stuff hits.
The daily chart above shows that the market has produced exactly this minimally expected price action, retracing a little more than 61.8% of late-Jul/early-Aug’s plunge from 3030 to 2776. Our challenge now is discerning whether this recovery is a resumption of the secular bull trend to eventual new all-time highs like that that followed Apr-May’s correction OR a correction within a peaking/reversal process that could have devastating consequences.
Floundering price action from recent prices around this 61.8% retrace, indicated initially by a short-term mo failure below 2866, would be the first sign of still-developing weakness and vulnerability. A subsequent larger-degree break below 06-Aug’s 2776 low and our key risk parameter would confirm this developing weakness on a larger scale and could open the floodgates to indeterminable and potentially severe losses.
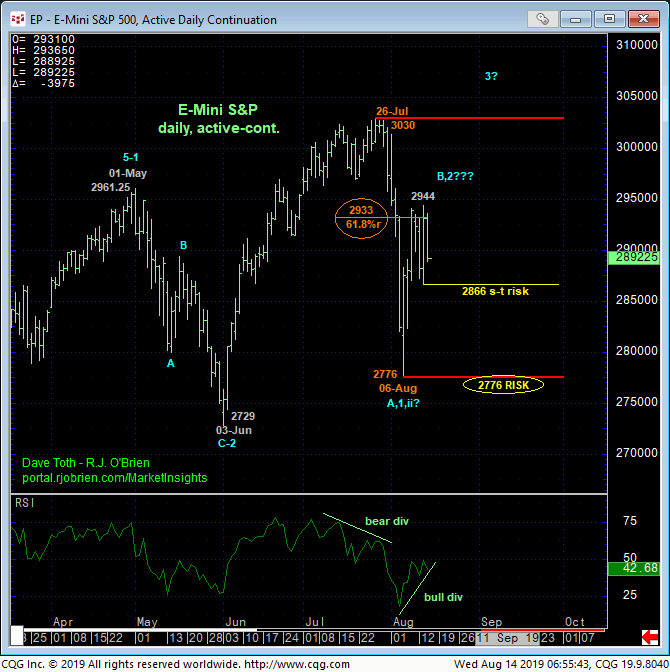
We will discuss below ancillary factors that would seemingly reinforce a broader bearish count as well as factors still in place that would be consistent with a broader bullish count. One still-bullish factor is simply that the market has yet to break 06-Aug’s 2776 low and key risk parameter. Another is that, on a daily close-only basis below, the late-Jul/early-Aug plunge is virtually identical in length (i.e. 1.000 progression) to Apr-May’s preceding plunge.
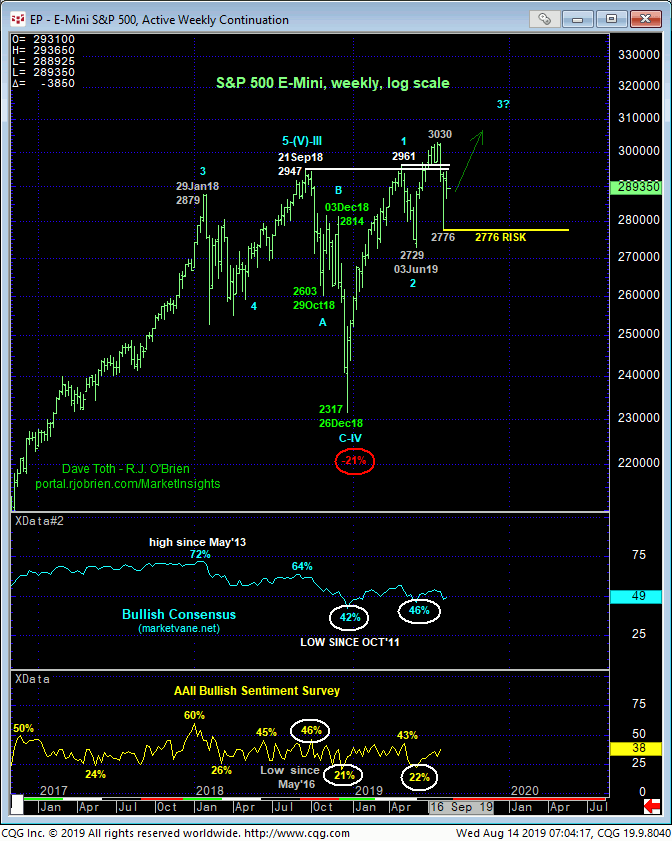
Another factor that we believe still better serves a broader bullish count is the sentiment/contrary opinion fact that the huddles masses are anything but frothy-bullish this market. The Bullish Consensus (marketvane.net) and AAII Bullish Sentiment Survey shown in the weekly log chart below show depressed levels that have been associated with the ENDS of bull market corrections ahead of resumptions of the secular advance. f the market fails below 06-Aug’s 2776 low however or closes below 05-Aug’s 2825 low close, this sentiment/contrary opinion factor will be discarded as not applicable given that a longer-term downtrend would have been confirmed.
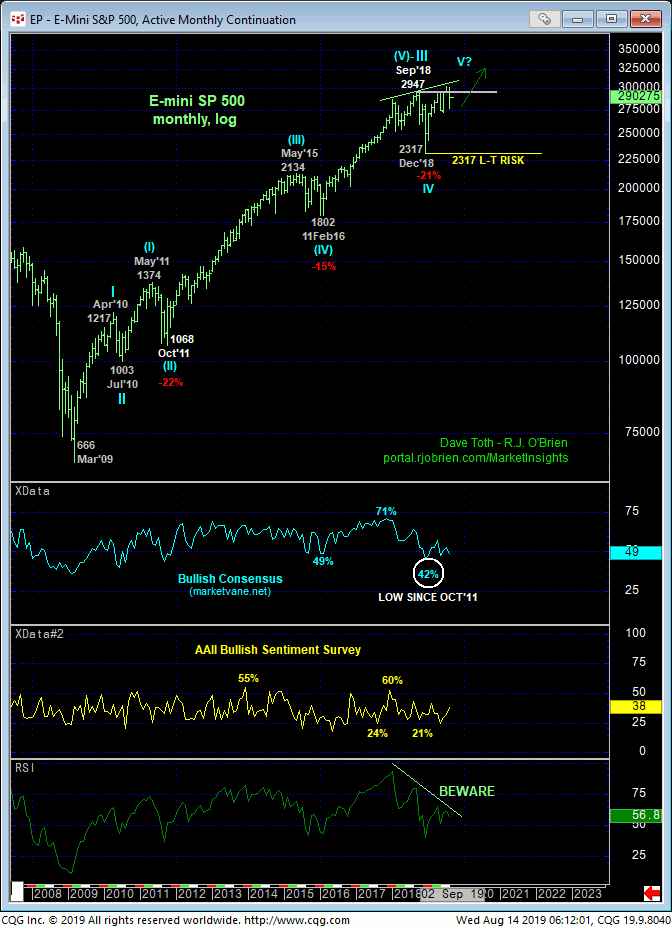
A threat to the secular advance is waning momentum on a massive monthly scale below. On this scale however, commensurately larger-degree weakness below Dec’18’s 2317 larger-degree corrective low is required to CONFIRM this signal to the point of long-term bearish action. Neutralizing bullish exposure at a level prior to that like we’d be advocating on a sub-2776 failure acknowledges and accepts whipsaw risk in exchange for lesser nominal risk.
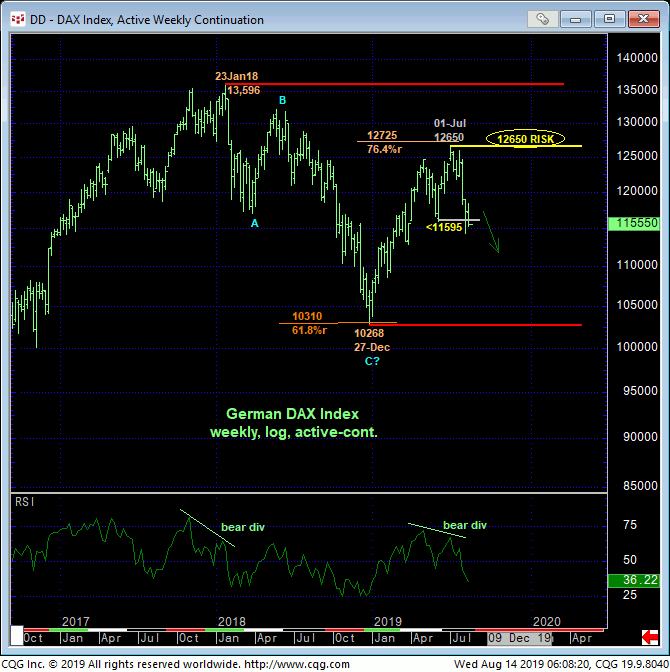
Another threat to a generally bullish count globally is the Dax Index’s bearish divergence in WEEKLY momentum with last week’s failure below 03-Jun’s 11595 corrective low shown in the weekly log chart below. Stemming from the upper-quarter of the past year-and-a-half’s range, this mo failure warns of at least further lateral-to-lower consolidation in the weeks and probably months ahead that could produces prices near or below 27Dec18’s 10268 low.
Such German equity weakness does not necessarily translate to weakness in U.S. equities, but it’s a factor that bears watching until and unless the S&P busts out above 26-Jul’s 3030 all-time high.
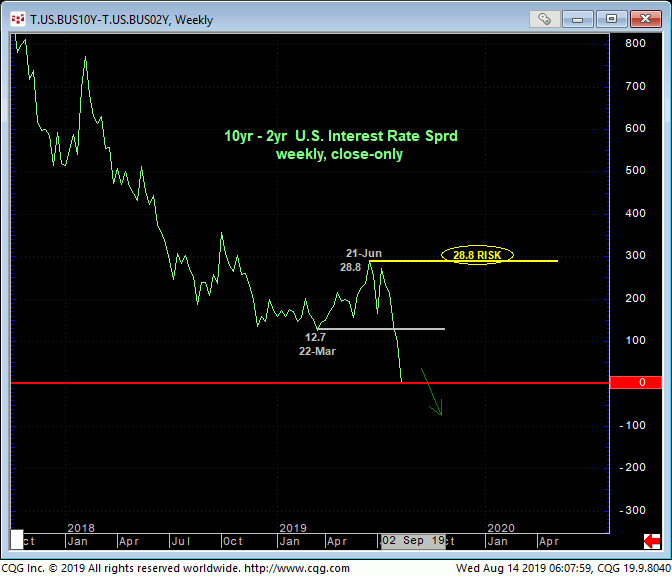
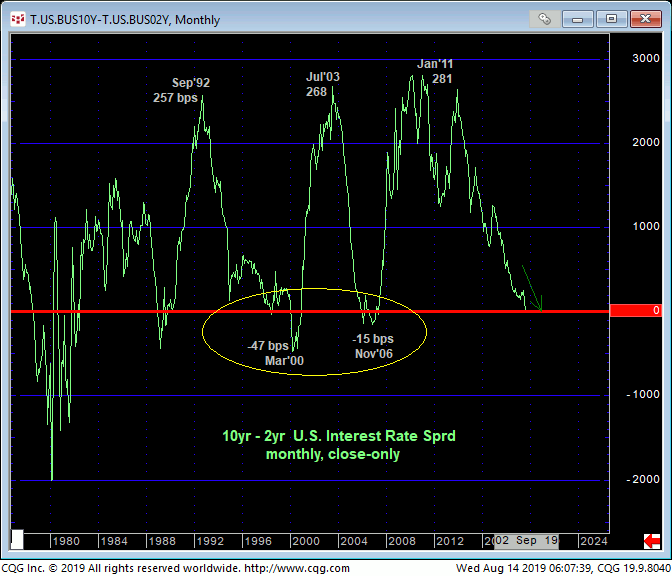
Another factor that certainly bears watching is the flattening/on-the-verge-of-inverting of the 2s-10s yield curve shown in the weekly (above) and monthly (below) charts. This month’s break below 22-Mar’s 12.7 weekly low reaffirms the major downtrend/flattening that’s now on the cusp of inversion. The monthly chart below shows that each of the past two inversion cases lead to major peak/reversal environments in U.S. equities.
HOWEVER, merely the FIRST inversion spike does not necessarily mean an equity meltdown is imminent. This spread inverted initially in Jun’98 and did lead to a 3-month, 22% decline before the secular bull resumed. In the Dec’05 cases however, the S&P bull continued 27% higher until Oct’07.
Against this yield curve inversion backdrop, PROOF of weakness below 06-Aug’s 2776 low cannot be ignored as resumed weakness and vulnerability that could produce indeterminable and potentially severe losses thereafter.
These issues considered and from the middle of the past few weeks’ range, traders are advised to acknowledge aimless whipsaw risk and be flexible to pokes either way within the range. A short-term failure below 2866 will tilt intra-range directional scales lower, negating any shorter-term rationale for being long. Subsequent and commensurately larger-degree weakness below 06-Aug’s 2776 low exposes a peak/reversal threat that could be major in scope, warranting the immediate cover of all long-term bullish exposure as the market’s downside potential thereafter would be indeterminable and potentially severe. Resurrected strength above yesterday’s 2944 high would reinforce a bullish count that, while still below the upper-quarter resistance of the past few weeks’ range, would be consistent with a broader bullish count and reinforce recent corrective lows
