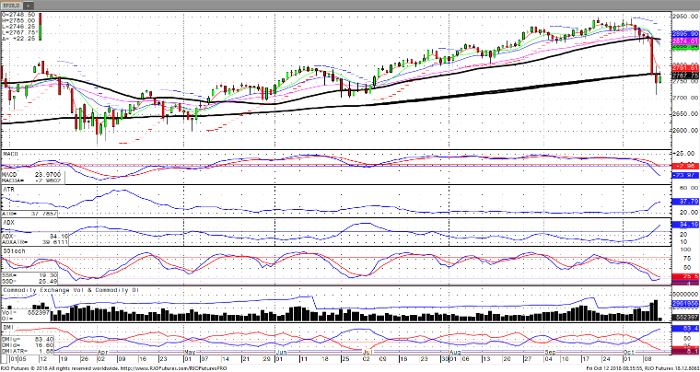
The wild ride continues on Wall Street with one of the worst weeks we have seen in years. The S&P 500 fell over 4% while the volatility index rallied over 29%. The market felt toppy once we saw headlines about this move being the “longest bull market ever” or its been “3,000 + days since a correction of over 20%”. Keep an eye on the 200-day moving average, the last few corrections we have seen back earlier in the year have held. Both the 200-day exponential and simple moving averages come in right about at 2775.50 and should be strong support. Next week’s data is packed with a combination of earnings that are generally expected to be positive and a flood of economic data. The economic data scheduled should show weaker results due to the recent rapid rise in interest rates. The 30-year t-bond hit its highest level since 2014 and the 10-year hit its highest level since 2011. I do expect interest rates to come down from these historic levels due to the Feds over tightening. These high rates should weigh in on housing starts and existing home sales and could weigh equity prices next week.
E-Mini S&P 500 Dec ’18 Daily


