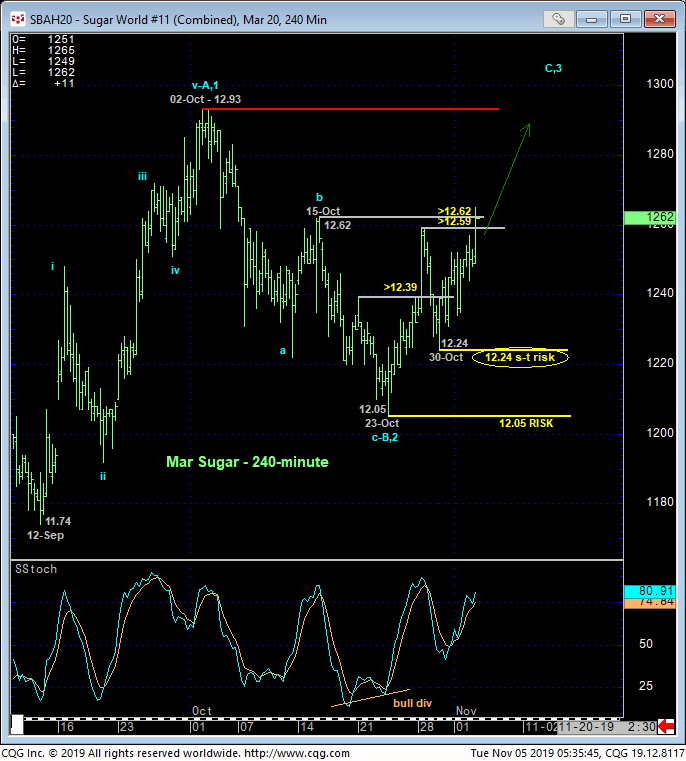
Readers of our technical blog know that we’re typically not fans of initiating directional exposure from the middle-halves of ranges due to poor risk/reward merits and greater odds of aimless whipsaw risk. Indeed, the past few weeks’ choppy, lateral price action shown in the 240-min chart is an excellent example of such whipsaw behavior.
The key to any such intra-range directional punts is RISK DEFINITION and directional potential. And this morning’s break above both 28-Oct’s 12.59 initial counter-trend high and 15-Oct’s 12.62 prior corrective high and short-term risk parameter not only confirms a bullish divergence in daily momentum (below) that defines smaller- and larger-degree corrective lows at 12.24 and 12.05 that can now be used as objective risk parameters to bullish decisions, this recovery renders Oct’s 12.93-to-12.05 sell-off attempt a 3-wave affair as labeled above. Left unaltered by a relapse below 12.05, this 3-wave decline is considered a (B- or 2nd-Wave) corrective/consolidative event that warns of a resumption of Sep’s (A- or 1st-Wave) uptrend that preceded it. And once above 02-Oct’s 12.93 high, the market’s upside potential is indeterminable and, as we’ll discuss below, potentially enormous.
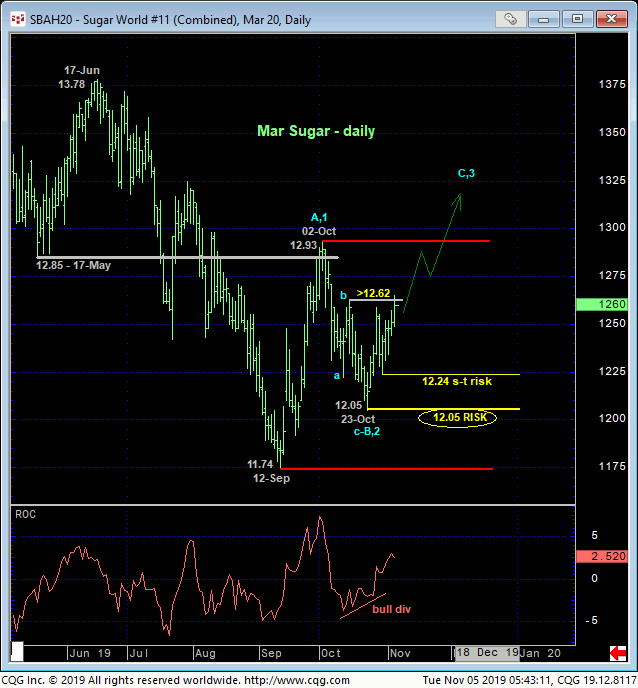
The weekly log chart of the prompt Mar contract above shows is inability thus far to sustain Sep’s break below Sep’18’s prior key low at 12.12, indicating some semblance of “non-weakness”. It’s kind of hard and subjective at this point to call recent price action “strong” as this market still needs to recoup 02-Oct’s 12.93 high to break the long-term downtrend. Herein lies the prospective bull’s requirement to BEHAVE LIKE ONE above 15-Oct’s 12.62 high by sustaining trendy, impulsive behavior up through 12.93 and without relapsing below 12.24 and certainly 12.05.
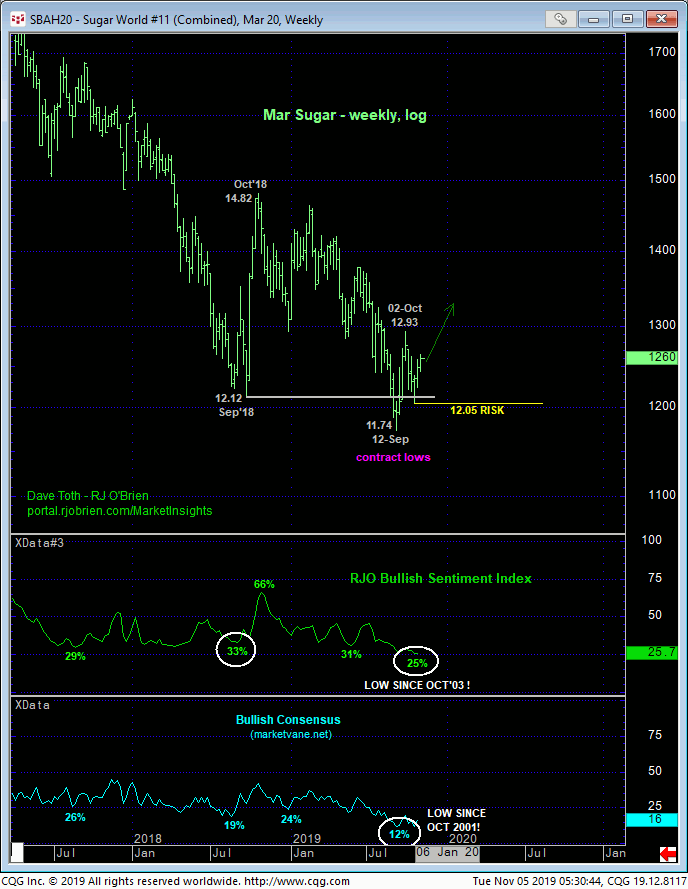
On a weekly log active-continuation basis below, the relapse attempt from Oct’18’s 14.24 high to 12Sep19’s 10.68 low is about as labored and corrective-looking as it gets. Coming on the heels of Aug-Oct’18’s trendy, impulsive initial counter-trend rally and confirmed bullish divergence in WEEKLY momentum, a major, multi-quarter base/reversal threat remains intact until and unless this market fails below at least 23-Oct’s 12.05 low in the Mar contract and arguably until the market breaks 12Sep19’s 10.68 low on an active-continuation basis.
CRITICAL to this major base/reversal process and unique and compelling buying opportunity are the sentiment/contrary opinion indicators. The weekly charts above and below show both our proprietary RJO Bullish Sentiment Index and the Bullish Consensus (marketvane.net) at historically bearish levels not seen since 2003 and 2001, respectively! Combined with the past YEAR’S worth of basing behavior as well as the past couple weeks’ intra-range recovery, we believe this market could be VULNERABLE to potentially huge, even relentless gains in the weeks, months and even quarters ahead and to levels well above not only Oct’s 12.93 high in the Mar contract, but also above Oct’18’s 14.24 high.
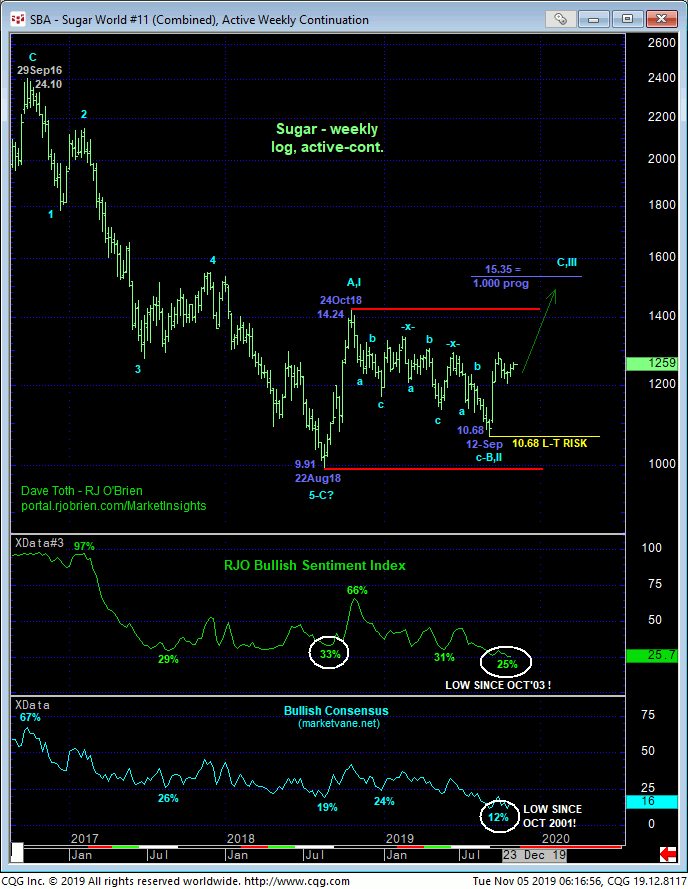
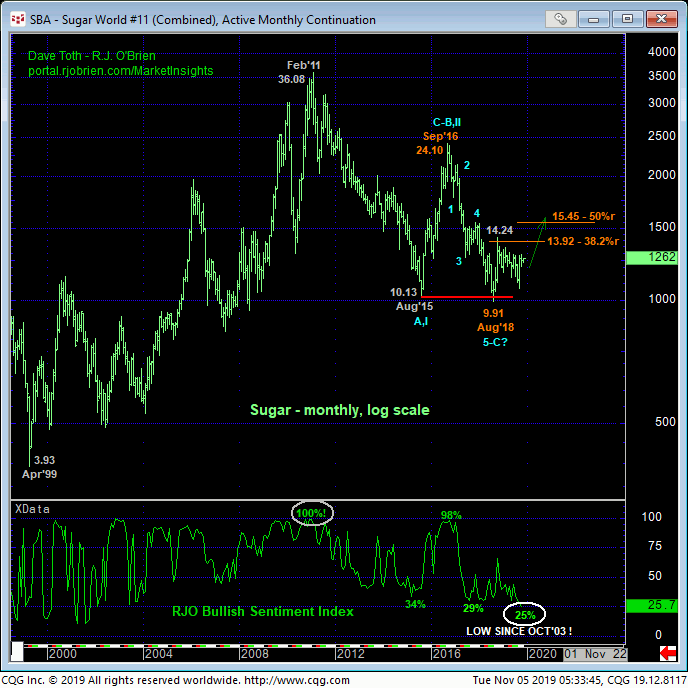
On an even broader scale, the monthly log active-continuation chart below shows the market’s rejection thus far of the 10.00-area that has provided obvious key support for the past FOUR YEARS. The prospect that the Sep’16 – Aug’18 decline from 24.10 to 9.91 is a complete 5-wave Elliott sequence is clear. The market has thus far retraced a Fibonacci minimum 38.2% of this decline. But given the bull-flag, corrective nature of Oct’18-to-Sep’19’s relapse attempt and the past couple weeks’ rebound that renders early-Oct’s sell-off attempt as a 3-wave and thus corrective structure, we believe all the necessary elements are in place for at least a rally from Sep’s 10.68 low of the same magnitude and demeanor (i.e. 1.000 progression) as Aug-Oct’18’s initial rally from 9.91 to 14.24 that could project to the 15.35-area in the weeks and months ahead.
These issues considered, traders are advised to move to a new bullish policy and exposure at-the-market (12.59 OB) with a failure below 12.24 required for shorter-term traders to step aside and commensurately larger-degree weakness below 12.05 for long-term players to take similar defensive steps. In lieu of such weakness, further and possibly steep, accelerated gains should not surprise with 02-Oct’s 12.93 high the next pertinent upside threshold for the bull.