Posted on Dec 05, 2023, 08:55 by Dave Toth
MAR GERMAN BUND
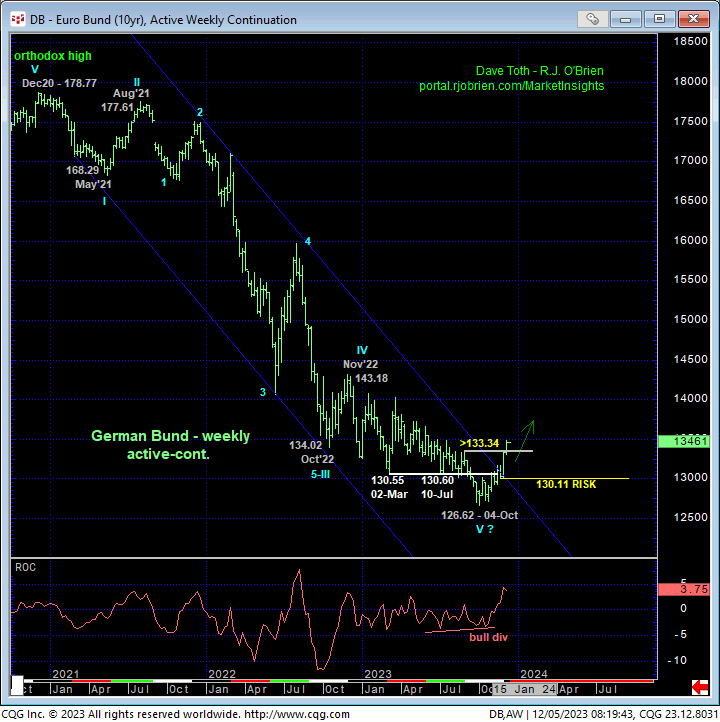
This week’s break above 01-Sep’s 133.34 larger-degree corrective high and key long-term bear risk parameter confirms a bullish divergence in WEEKLY momentum that breaks AT LEAST the downtrend from Nov’22’s 143.18 high and may have completed a massive 5-wave Elliott sequence that dates from Dec’20’s 178.77 high as labeled in the weekly active-continuation chart below. As we’ll detail below, we’re defining 24-Nov’s 130.11 low as our new long-term parameter from which longer-term institutional players can objectively base non-bearish decisions like short-covers and new bullish exposure. Until/unless this market weakens below at least 130.11 and certainly 04-Oct’s key 126.62 low, we should not underestimate the early prospect of a base/reversal environment that could be massive in scope, correcting or reversing a 3-YEAR downtrend that could span quarters or even years.
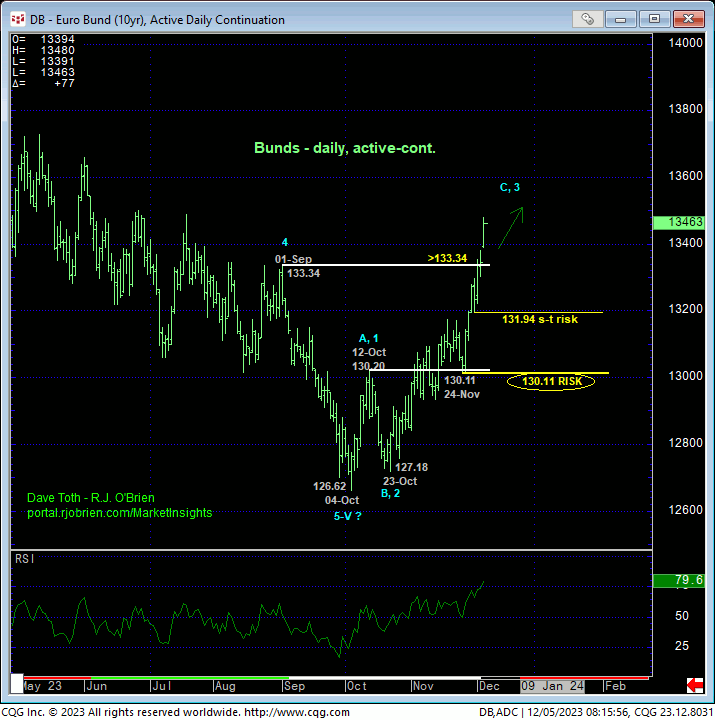
The daily active-continuation chart above, that is now reflecting Mar24 as the prompt contract, clearly shows not only the extent of the recovery from 04-Oct’s 126.62 low, but also the impulsive, accelerated nature of the portion of this reversal from 23-Oct’s 127.18 low that has “3rd-wave” written all over it. On this active-continuation basis, smaller- and larger-degree corrective lows exist at 131.94 and 130.11 and serve as our new short- and longer-term bull risk parameters from which short- and longer-term traders can objectively rebase and manage the risk of all non-bearish decisions like short-covers and new bullish exposure.
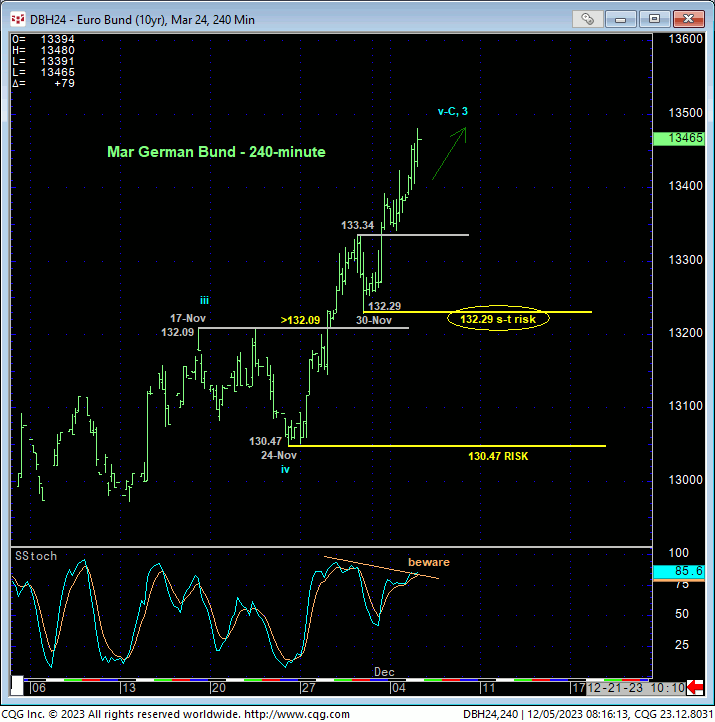
Basis the now-prompt Mar24 contract, these corrective lows are shown at 132.29 and 130.47, respectively. If the rally from 24-Nov’s low(s) is the 3rd-Wave of a broader base/reversal count as opposed to a bear market correction-completing C-Wave however, this market shouldn’t come anywhere near even 30-Nov’s smaller-degree corrective low(s) at this juncture.
These issues considered, a bullish policy remains advised for shorter-term traders with a failure below 132.29 required to threaten this call enough to warrant its cover. Longer-term institutional players have been advised to neutralize any/all remaining bearish exposure following the recovery above 133.34 and are further advised to establish a new bullish policy and exposure at-the-market (134.70) ahead of further and potentially long-lived gains with a failure below 130.11 required to negate this call and warrant its cover. in lieu of a failure below at least 132.29 and especially 130.11, further and possibly prolonged gains are anticipated.
DEC24 SOFR
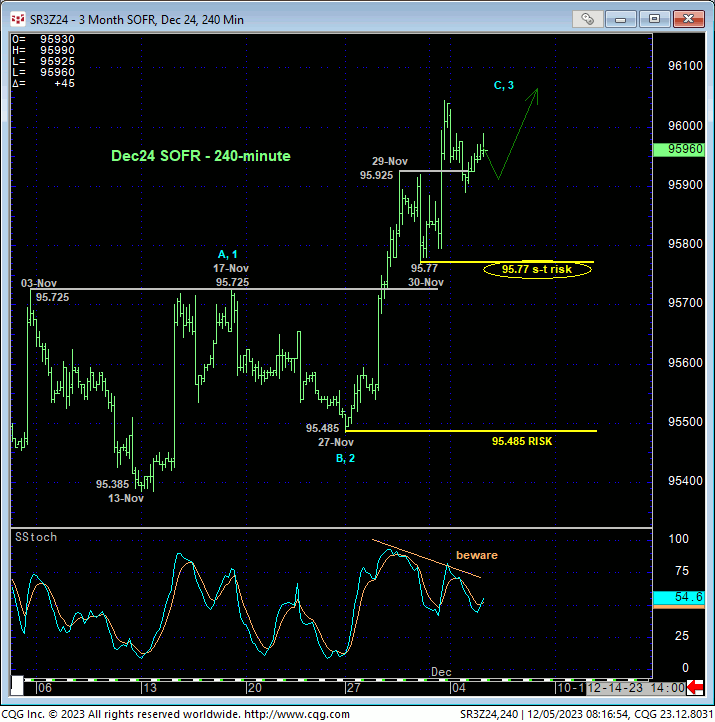
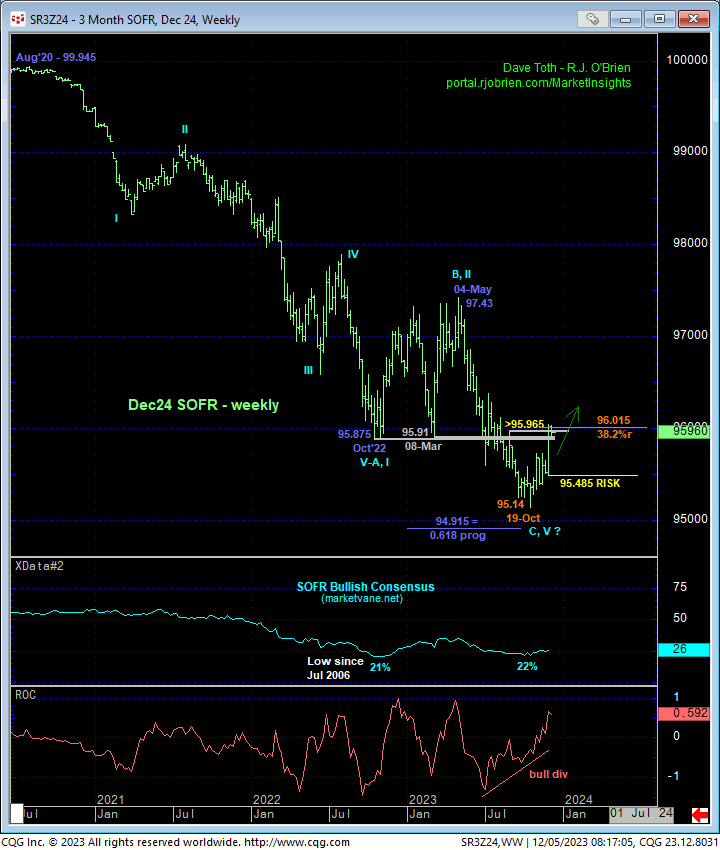
By virtue of Fri’s break above 01-Sep’s 95.965 larger-degree corrective high and key long-term bear risk parameter that confirms a bullish divergence in WEEKLY momentum, the bullish technical construct of and expectations for the SOFR contract are identical to those detailed above in the bunds. Historically bearish levels of market sentiment/contrary opinion as indicated by the Bullish Consensus (marketvane.net) reinforces this base/reversal call that identifies 19-Oct’s 95.14 low as the end of AT LEAST the downtrend from 04May23’s 97.43 high and possibly the end of a massive 5-wave Elliott sequence down from Aug’20’s 99.945 high. If correct, these elements warn of a correction or reversal higher that could easily span quarters or even years.
It should not be lost on us however that, thus far, the nearly-two-month recovery has only retraced a Fibonacci minimum of May-Oct’23’s portion of the 3-YEAR secular bear market and remains well within the bounds of another larger-degree bear market correction. Herein lies the importance of recent corrective lows and new bull risk parameters at 95/.77 and 95.485.
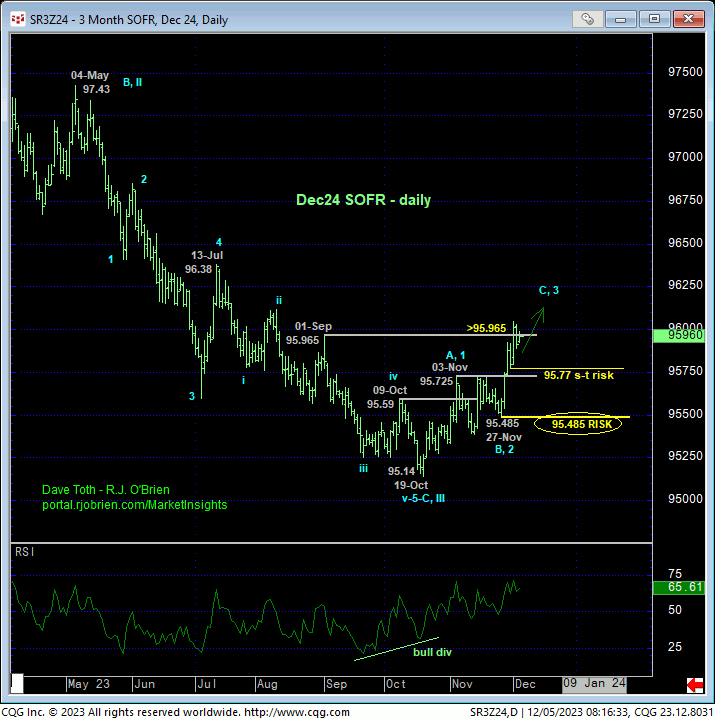
The daily chart above shows the past week’s recovery that clearly breaks May-Oct’s downtrend, leaving 27-Nov’s 95.485 low in its wake as either the B-Wave of another bear market correction or the dramatic or the 2nd-Wave within a major reversal higher. If the latter, bullish count is unfolding, meaning the rally from 95.485 is a 3rd-Wave, the market should not only not come close to relapsing below 95.485, but it should also blow to the roof off with sustained, trendy, impulsive and increasingly obvious behavior straight away.
On an even smaller scale, the 240-min chart below shows Fri’s continued, impulsive rally leaving Thur’s 95.77 low in its wake as the latest smaller-degree corrective low this market is now minimally required to fail below to confirm a bearish divergence in short-term momentum. In this regard, we’re defining 95.77 as our new short-term parameter from which shorter-term traders with tighter risk profiles can objectively rebase and manage the risk of a still-advised bullish policy and exposure.
These issues considered, a bullish policy remains advised for shorter-term traders with a failure below 95.77 required to defer or threaten this call enough to warrant defensive measures. Longer-term institutional players have been advised to neutralize any/all remaining bearish exposure on the recovery above 95.965 and are further advised to move to a new bullish policy and exposure with a failure below 95.485 required to negate this call, warrant its cover and re-exposer the secular bear. In lieu of weakens below at least 95.77 and especially 95.485, further and possibly long-lived gains are anticipated straight away.
