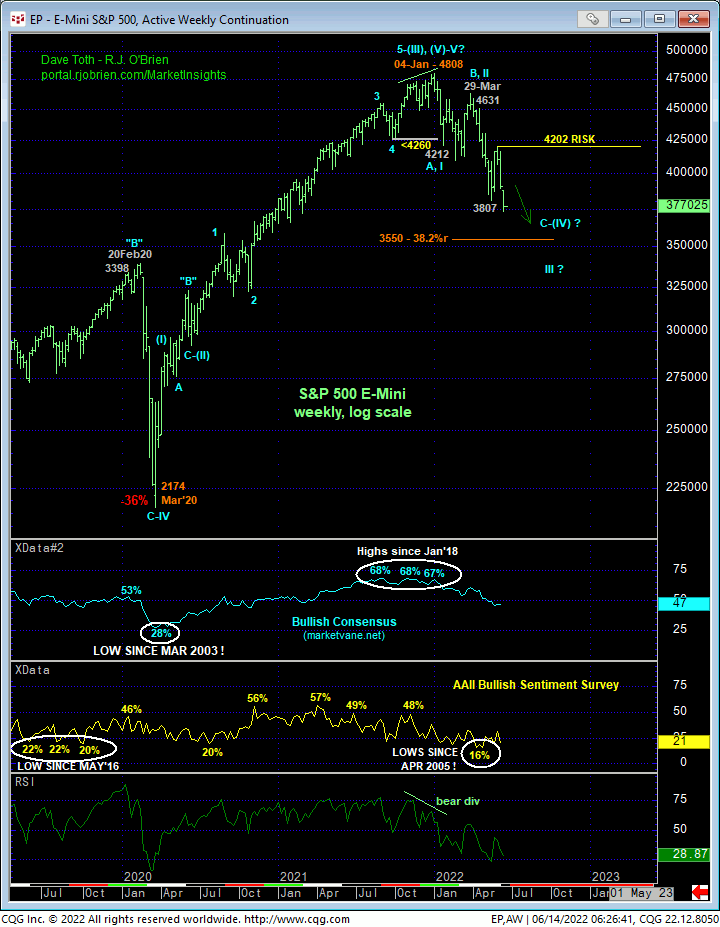
In a somewhat sadistic way, the moment a market reinforces one of our preferred counts, we start looking for and acknowledging the prospective flies in the ointment; in other words: to DEFINE RISK. As discussed in yesterday’s Technical Blog, yesterday’s break below 20-May’s 3807 low reinstates and reaffirms the major bear trend from 04-Jan’s 4808 intra-day high and 03-Jan’s 4785 all-time high close. In the 240-min chart below, we’ve specified short- and long-term risk parameters at 4076 and 4202, respectively.
IF this market is in for a more debilitating annihilation sooner rather than later per the major peak/reversal elements we’ve been discussing since Jan, it is now important for the bear to continue to BEHAVE LIKE ONE by sustaining trendy, impulsive, increasing obvious, even relentless losses straight away. Former 3800-to-3900-range support should easily cap any corrective recovery attempts as resistance, with any bounces not being able to come anywhere near our risk parameters specified above, let alone recover above them. At this moment, the trend is down on all scales and should not surprise at all by its continuance or acceleration straight away.
From a longer-term perspective however, we address a prospective fly in the bearish ointment that could be a temporarily surprising relief to anyone who still owns equities.
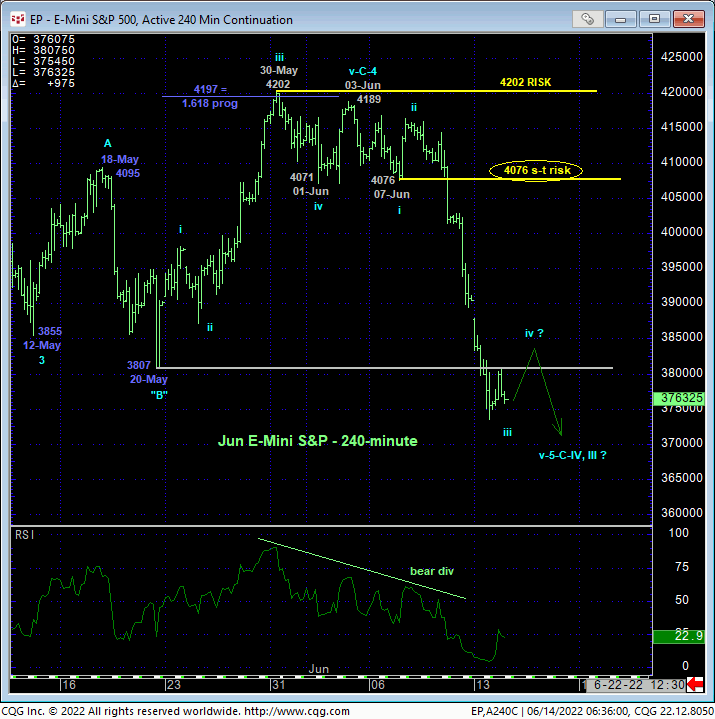
The daily log close-only chart above shows the past five months’ 21.5% decline from 03-Jan’s 4785 high. This month’s resumed plunge reinstates this major downtrend and exposes indeterminable and potentially extreme losses straight away. Former 3900-area support from mid-May SHOULD now hold as resistance ahead of potentially steep losses. 02-Jun’s 4178 corrective high close is THE larger-degree corrective high and key long-term bear risk parameter this market is required to recoup to, in fact, break this year’s downtrend and expose a larger-degree correction higher or resumption of the secular bull trend.
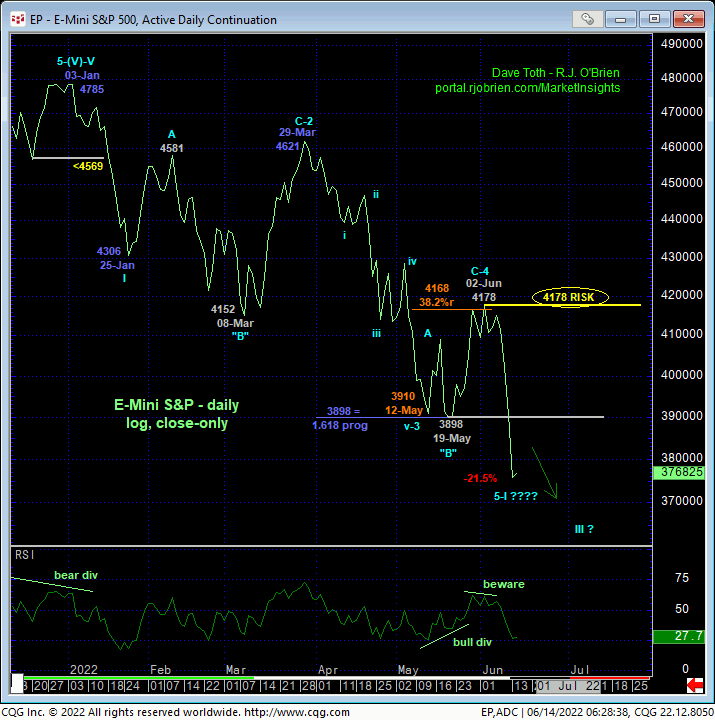
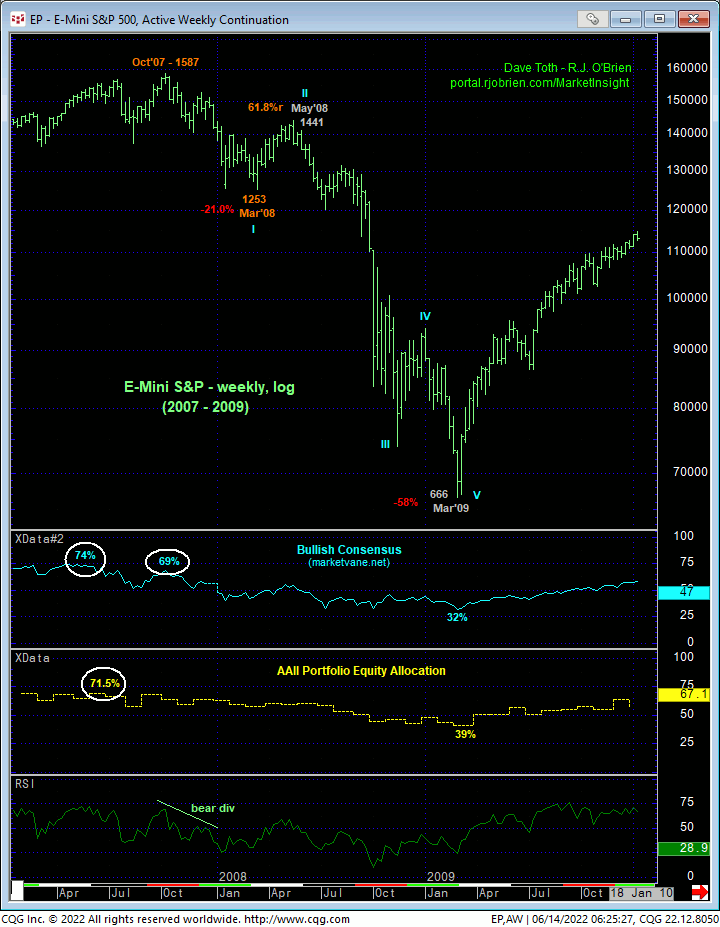
Against this backdrop, we must acknowledge the prospect that this latest plunge from 4178 could be the completing 5th-Wave to the INITIAL component of a massive peak/reversal process ahead of a major bear market that has quarters or years to go. Since Jan/Feb, we’ve discussed long-term technical elements identical to those that warned of and accompanied all previous major corrections or reversals lower. With the 2007 – 2009 58% drawdown as good a representative of a bear as any, it is interesting to compare this year’s price action thus far to that from Oct 207’s 1577 high close shown in the daily log close-only chart below.
Eerily, the INITIAL (1st-Wave) decline from Oct’07’s 1577 high daily close to 10Mar08’s 1276 low spanned an identical five months to this year’s bear. And the 5-wave decline from Oct’07 to Mar’08 is not only a textbook example of a 5-wave Elliott sequence, it’s almost a mirror image of this year’s decline thus far from Jan’s 4785 high to yesterday’s 3757 low. On a closing basis, that initial 2007-08 decline lost 19%. From an intra-week high to intra-week close (as shown in the weekly log chart further below), that initial 2007-08 decline lost 21%. This year’s high-to-low loss is 22%.
Following early-Mar’08’s plunge to a new low for that developing bear trend however, the market’s FAILURE TO SUSTAIN those losses below former support-turned-resistance and subsequent BULLISH divergence in momentum broke that initial 5-month downtrend and exposed an extensive corrective recovery that spanned two months. It is precisely this type of NON-BEARISH behavior that we must keep our eyes peeled for in the period immediately ahead.
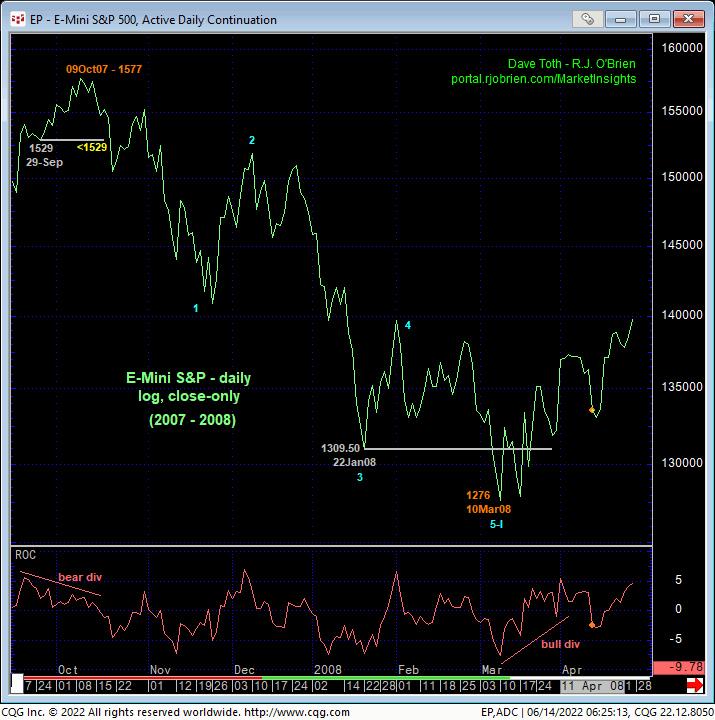
The weekly log chart below shows the same momentum and contrary opinion elements in Sep/Oct 2007 that we identified back in Jan. This chart also shows Oct’07 – Mar’08’s initial 1st-Wave decline from 1587 to 1253, a 21% drawdown. Following mid-to-late-Mar’s bullish divergence in momentum, the market recovered extensively for a 2nd-Wave correction, retracing 61.8% of Oct’07 – Mar’08’s initial 1st-Wave decline, BEFORE THE 3RD-WAVE BOTTOM FELL OUT that ultimately led to a 5-wave, 17-month, 58% bear market.
It is this prospective multi-week or even multi-month (2nd-wave) correction that we must now be aware of IF this market first starts recovering above the 3900-area and then certainly above 4178. The risk/reward opportunities around which to navigate such a count are extraordinary. But this is only if this market can now PROVE strength above at least the 3900-area. And we will certainly be keeping a keen eye on shorter-term momentum down here around the 3750-to-3700-area in the days/week ahead to perhaps get a leg up on such a corrective recovery. In lieu of such a confirmed bullish divergence in momentum, there is no way to know that our 5-month, 21% (thus far) drawdown comparison to 2007-08 isn’t totally wrong and the bottom is poised to fall out straight away.
The weekly log chart below clearly shows this year’s downtrend intact with an intra-week recovery above 4202 (4178 on a daily close basis) required to break this slide. Until a recovery above at least the 3900-area and especially this 4178-to-4202 area unfolds, there is now way to know how low “low” is for this market.
These issues considered, a bearish policy remains advised ahead of what could be protracted losses straight away. The purpose of our 2007-08 comparison above however is to be on the lookout for any bullish divergence in short-term mo in the period immediately ahead that could be the start to an extensive 2nd-Wave corrective recovery that would allow us to move deftly but objectively to an interim bullish stance within a multi-quarter peak/reversal process.
