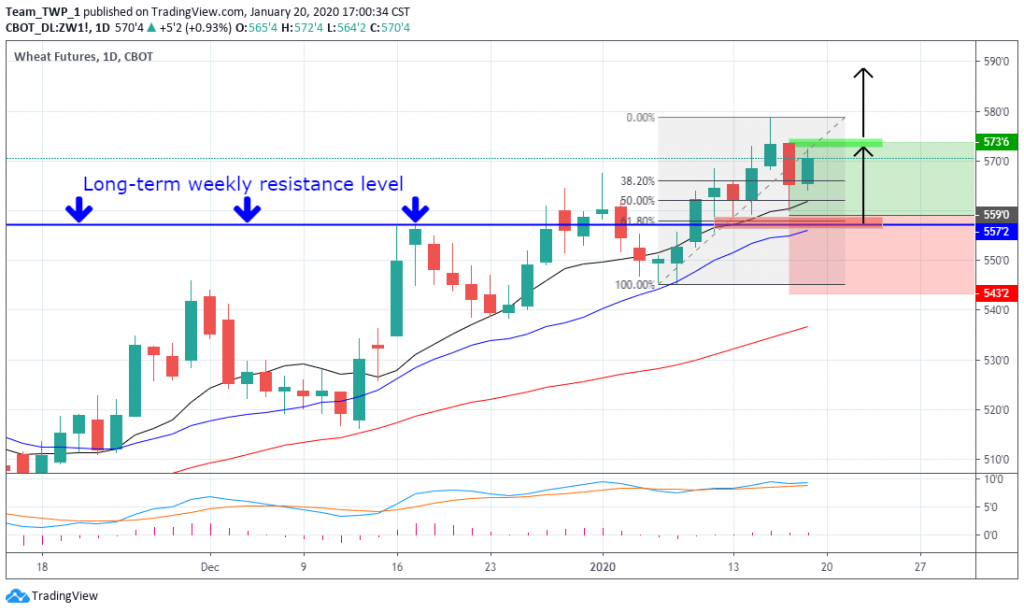
Wheat is in the very early stages of a new monthly uptrend, after having been trending lower since late 2012. The weekly has formed higher highs and higher lows, and the daily uptrend has recently retraced, after testing the weekly resistance at 557’2.
The momentum indicators are also trending upwards, supporting a bullish move.
Price action has just produced a small bullish candle and we’re looking for price to break the high of this candle in the next session. This is the area highlighted in green at 573’1.
There is little significant resistance in the immediate area above this.
For a stop-loss, consider the previous bear candle at 559’6, or a little further down, tucked underneath recent support at 557’2. This is also a Fibonacci 61.8% level.
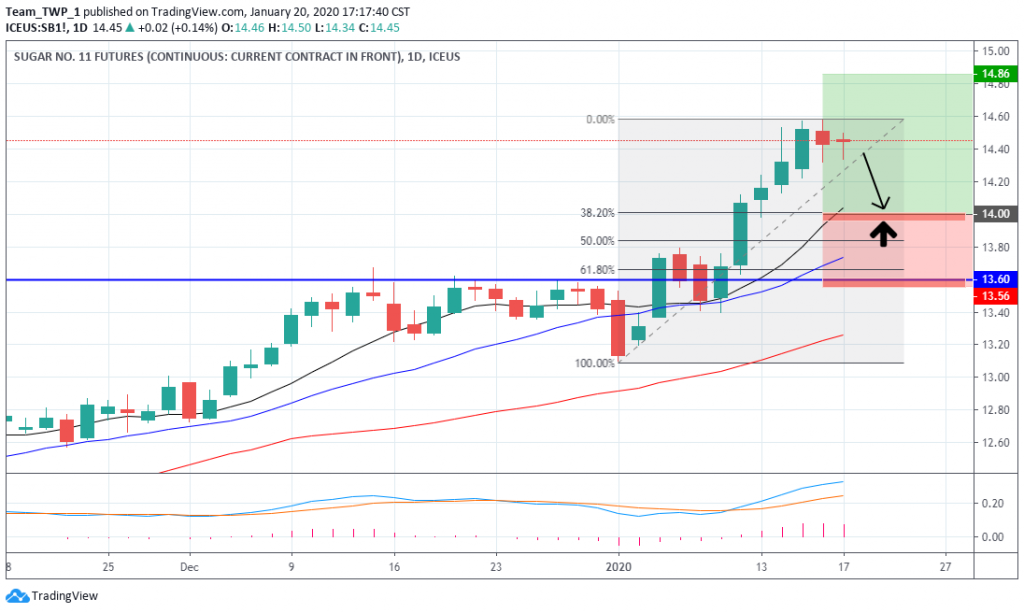
On the monthly timeframe, Sugar has rejected long-time lows – once in 2018 and again in 2019. It is now shifting its momentum to the upside.
The weekly is trending upwards aggressively but is now approaching over-extension.
The daily is also due to retrace back to the 10-period moving average, and price action offers two potential retracement targets, either 14.00 or lower down at 13.60.
These two levels correspond with 38.2% and 61.8% Fibonacci levels respectively.
We’ll be waiting for a small bullish candle to form at either of these levels for a potential long opportunity. The areas highlighted in red would be potential stop-loss placements, almost certainly tucked below the low of this (yet-to-be-formed) bullish candlestick.
However, should the subsequent candle break the low of this candle before breaking the high, we will consider the trade setup negated.