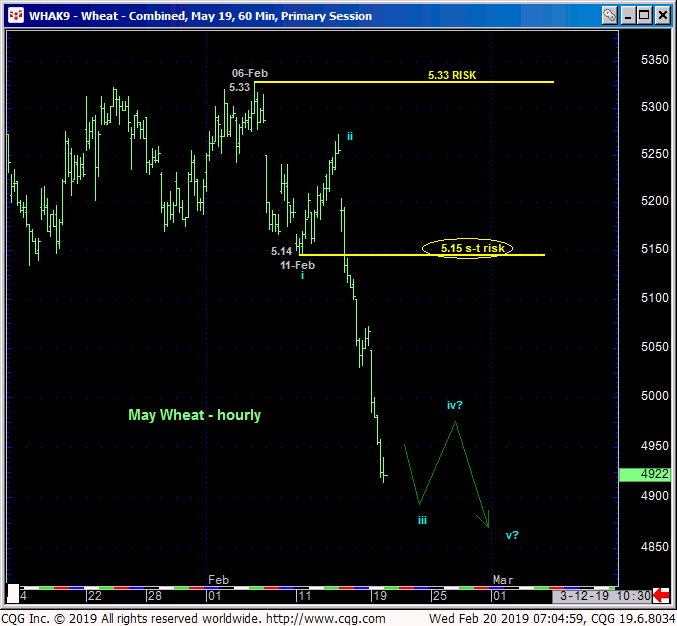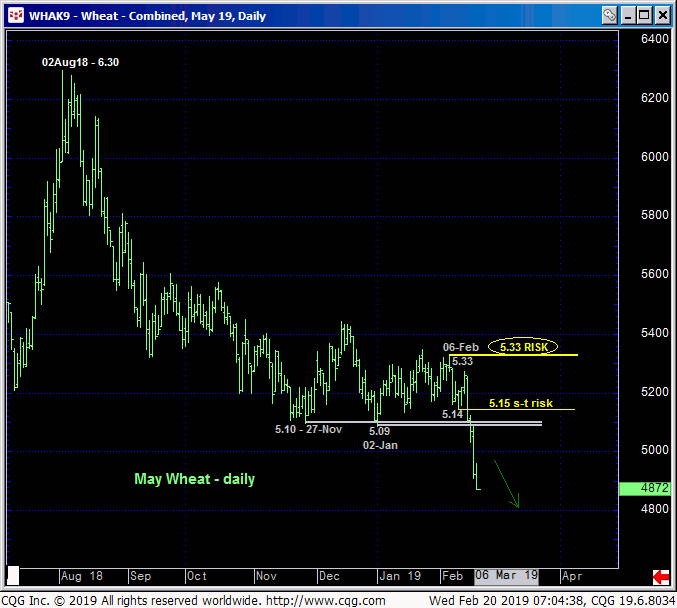

The past couple days’ continuation of Fri’s break below critical 5.10-area support obviously reinforces a bearish count and identifies former 5.09-to-5.14-area support as new resistance and 06-Feb’s 5.33 corrective high as a key new risk parameter in the now-prompt May contract. But the extent and impulsiveness of this downside follow-through forebodes a bearish count that could be major in scope, maybe even resurrecting the 11-year secular bear market. For shorter-term traders with tighter risk profiles, 11-Feb’s 5.14low is considered a minor 1st-Wave low of a likely 5-wave Elliott sequence down from 06-Feb’s 5.33 high and thus serves as our new short-term risk parameter to a bearish policy and exposure.


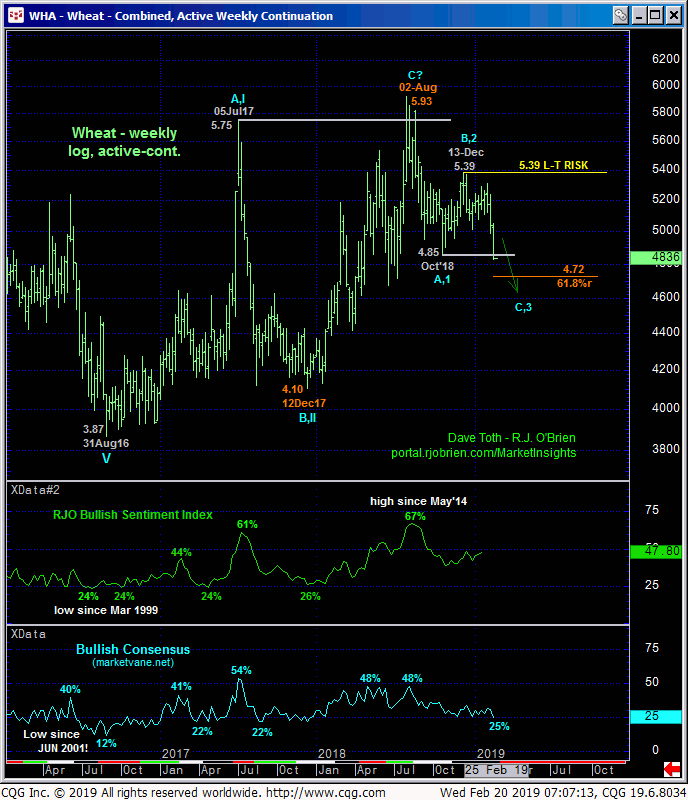
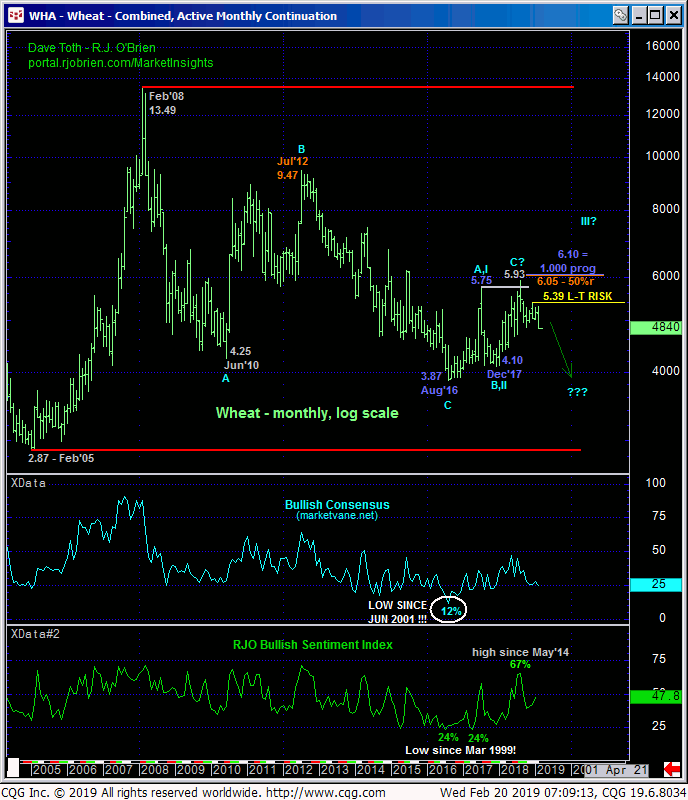
Crucially, this week’s decline breaks last Oct’s 4.85 initial counter-trend low stemming from Aug’18’s 5.93 high and reaffirms a downtrend on a major scale. Given the prospect that the entire 2016 – 2018 recovery attempt from 3.87 to 5.93 is only a 3-wave and thus corrective sequence as labeled in the weekly log active-continuation chart above and monthly log chart below, we cannot ignore the uber bearish prospect that the secular bear market may be resuming. Such a count would call for a run to new lows below 3.87 without the market trading even 23-cents high (above our short-term risk parameter at 5.15).
If such a bearish count is what the market has in store, then the past couple weeks’ resumed slide would be the dramatic 3rd-Wave of an eventual 5-wave sequence down from Aug’18’s high. This wave would be characterized by very trendy, impulsive, even relentless losses straight away, never even coming close to threatening this count with a recovery above a level like 06-Feb’s 5.33 high or even prior support-turned-resistance around 5.15.
The Bullish Consensus (marketvane.net) measure pf market sentiment is at a historically LOW level of 25% that is typical of broader BASE/reversal environments. And perhaps this indicator is warning of an alternate bullish count that contends that the resumed decline from Dec’s 5.39 high is the completing C-Wave of a major bull market correction. But traders are reminded that sentiment/contrary opinion is not an applicable technical tool in the absence of an accompanying bullish divergence in momentum needed to stem the clear and present downtrend. Herein lies the importance of specified bear risk parameters at 5.15 and 5.33.
These issues considered, a full and aggressive bearish policy and exposure are advised starting from at-the-market (4.85) and on a scale-up to 5.00 with strength above at least 5.15 and preferably 5.33 required to threaten or negate this call. Producers are advised to establish bear hedges with strength above at least 5.15 required to pare or cover this protection. The market’s downside potential is indeterminable and potentially severe.


