In the early morning trade, August gold is trading slightly in the green for the day and currently trading at $1,413 an ounce. The headlines overnight suggest that the U.S. and China are both standing strong on their trade stances before this weekend’s meeting between the two world super powers at the G-20 meetings in Osaka, Japan. At best, it sounds like more tariffs may just be delayed which would cause more economic uncertainty and some more gold buyers to come into the market. Furthermore, gold bulls and bears will be watching very closely at Q2 earnings which starts in just a couple of weeks and is expected to show companies growth slowing big time, so watch if gold can get more anxiety buying off any bad data.
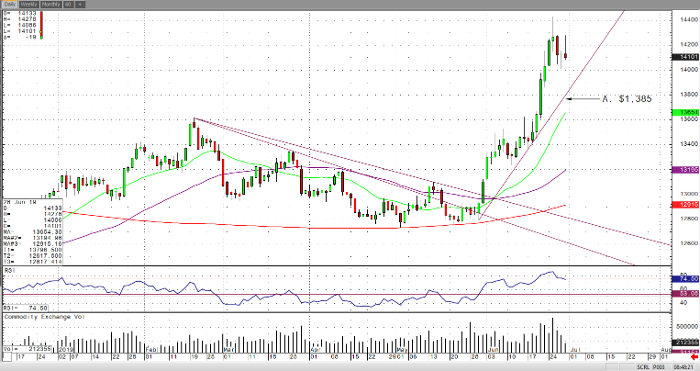
If you take a quick look at the daily August gold chart, you’ll clearly see the strong up trend along with maybe a short-term top on the shiny one. Gold bulls should look for support at between the trendline of $1,385 and the 20-day moving average at $1,365. Gold bears should look for resistance at this week high of $1,442 an ounce or a break below $1,365. I highlighted levels below on my RJO Pro daily August gold chart.
Gold Aug ’19 Daily Chart


