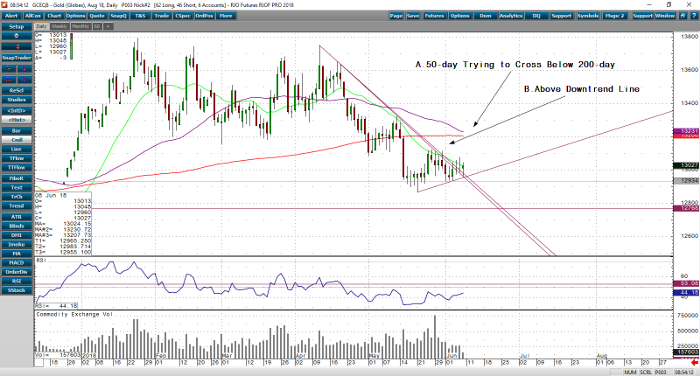
In the early morning trade, gold is ever so slightly trading down today and currently trading at $1,302.7. Gold has remained in a back and forth three-week trading range and looks like it’s prone to break out in either direction. August gold is hanging in there quit well this morning even with the US dollar trading higher overnight. Some could say gold is losing its role as a safe-haven to silver, which also has more physical demand than gold. Gold might be trading in this tight trading range until after the June 12 summit with North Korea as investors and traders alike passionately await an outcome. Furthermore, the negative rhetoric from some G-7 leaders that they aren’t happy with the Trump admiration’s unfair trade practices talk against the United States can also be holding this gold market up in the midst of a stronger dollar.
Let’s take a quick look at the daily August gold chart, which is interesting. It looks like the 50-day MAV is trying to cross below the 200-day, which would mean a bearish death cross pattern has formed and is a very strong indicator for a big and further selloff in the market will accrue. However, the 50-day is starting to level off instead of sloping down, which means if this pattern fails, then a big momentum rally will occur. Furthermore, gold looks like it is slowly trending above a bearish trend line which I highlighted below, and the case can be made with the right factors coming into play that gold is ready to take off to the upside. However, I think the next major move might have to wait until the June 12 summit is over.
Gold Aug ’18 Daily Chart


