In the early morning trade, December gold is trading slightly in the red and has been in a very tight trading range over the last few weeks. However, gold has held above this week’s critical support low of $1,480, but will the weakness in the dollar might give the shiny one a much-needed lift? Furthermore, the U.S. greenback might continue its slide down due to the Feds growing calls to cut interest rates even further at the end of this month. However, with the agreement this week on a Brexit deal that has taken some anxiety buying out of the gold market, which does takeaway some confidence from the bull camp.
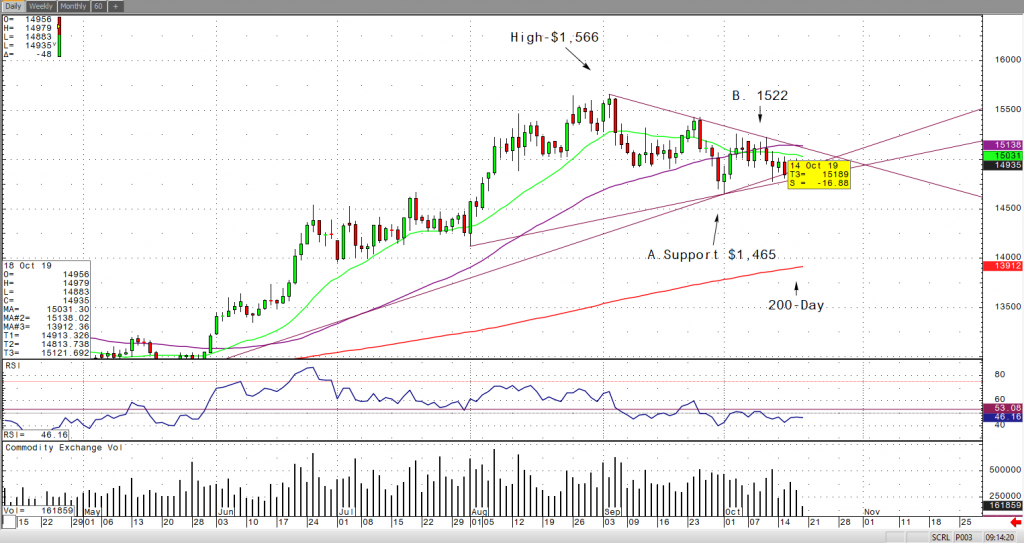
If we take a quick look at the daily December gold chart, you’ll see how it has been trading in a tight range which in return has created a symmetrical triangle pattern. Let’s keep it simple for the support and resistance levels. If gold breaks the low of $1,465, then it opens to a sell-off, possibly back to the 200-day moving average. If it breaks out though the top of the triangle of $1,522, then gold should enjoy a momentum rally back to the high of $1,566 an ounce. All levels are highlighted below on my RJO Futures daily December gold chart.