In the early morning trade, June gold is slightly down and has extended its three-day selloff, which it’s currently trading at $1,327.0. The two previous days were sizeable selloffs from the high of $1,362.2, so the shiny one is now down $35 dollars and trying to find some support at theses levels. The news earlier in the week that the US and China were working out some trade issues was the main cause of this three-day selloff. However, after a $35 selloff in just three days and with the US dollar selling off today, look for some support in gold at these levels. Furthermore, the US is still warning China about their ongoing tech piracy, so that can also find more gold bulls at these levels as well.
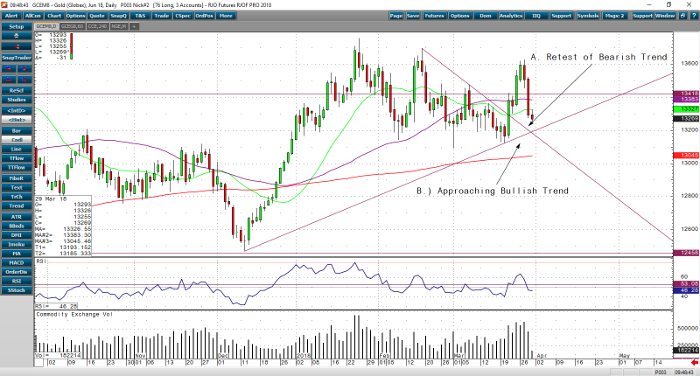
If we take a quick look at the daily June gold chart, we will find some technical support levels. The bearish trend line that gold broke above and held on March 21 is getting retested and now should act as support. Furthermore, if you take the low of December 12 and the most recent low of March 20, there is a bullish trend line that comes in roughly at $1,319.0 today. Both trend lines are at roughly the same price and should act as solid support for the shiny one. I highlighted these support levels below on our RJO PRO daily June gold chart.
Gold Jun ’18 Daily Chart


