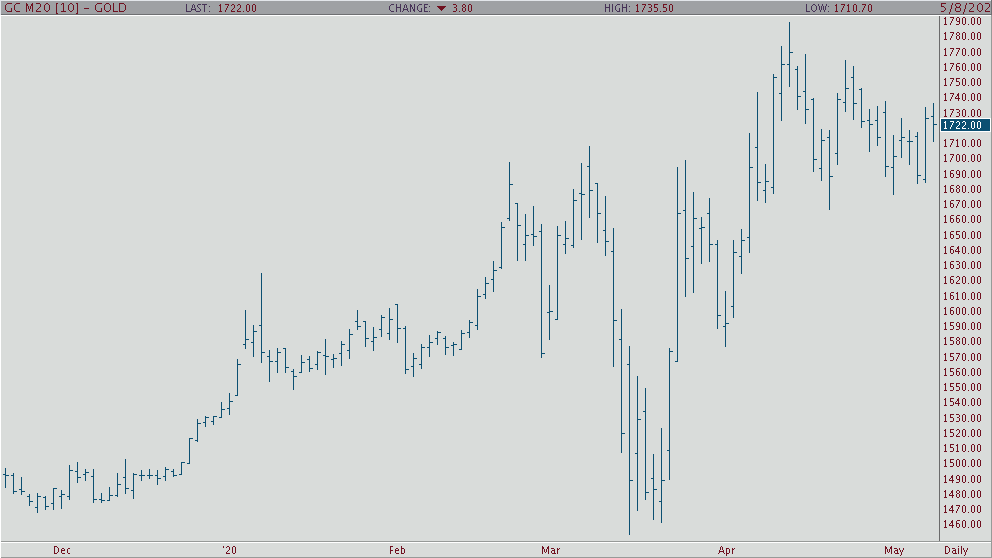
In the early morning trade, gold has given back all its overnight gains and is currently trading in the red at $1,715 an ounce. Before the April non-farm payroll data came out, gold was trading in the $1,730 range and was prone to break out and even test last month’s high of $1,788.8. As I mentioned above, today’s monthly non-farm payroll numbers came out and showed just how paralyzed the U.S. economy is with data showing 20.5 million layoffs in April and the overall unemployment rate is now at 14.7%, which is at its highest level since record keeping began in 1948. To put things in perspective for you, today’s number just erased more than a decade of job growth and are more than double what the U.S. saw in the 2008 financial crisis.
If we look at the daily June gold chart below, you’ll clearly see how gold held the $1,700 handle this week, which is a big victory for the gold bulls. Furthermore, gold is still trading in an uptrend and with today’s unemployment data and speculation on more fed & government stimulus one could say gives the gold bulls another long-term advantage to see higher prices.


