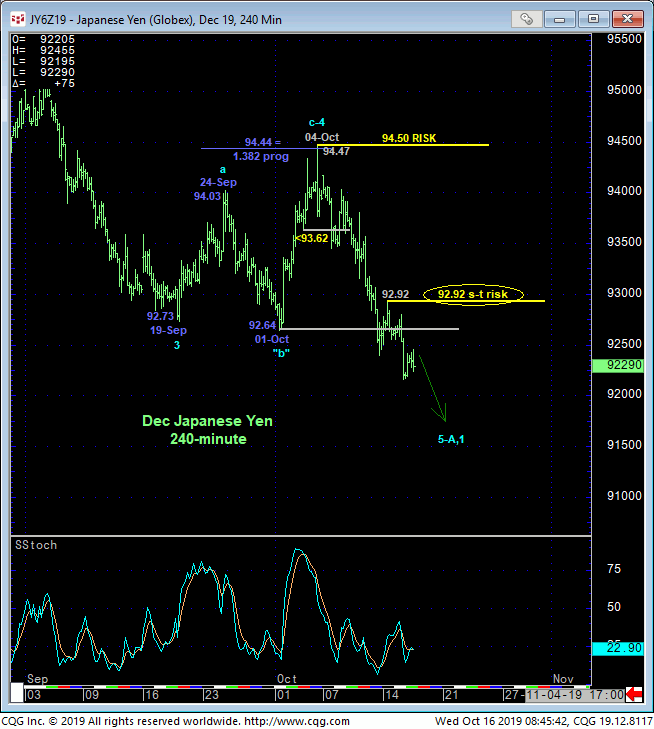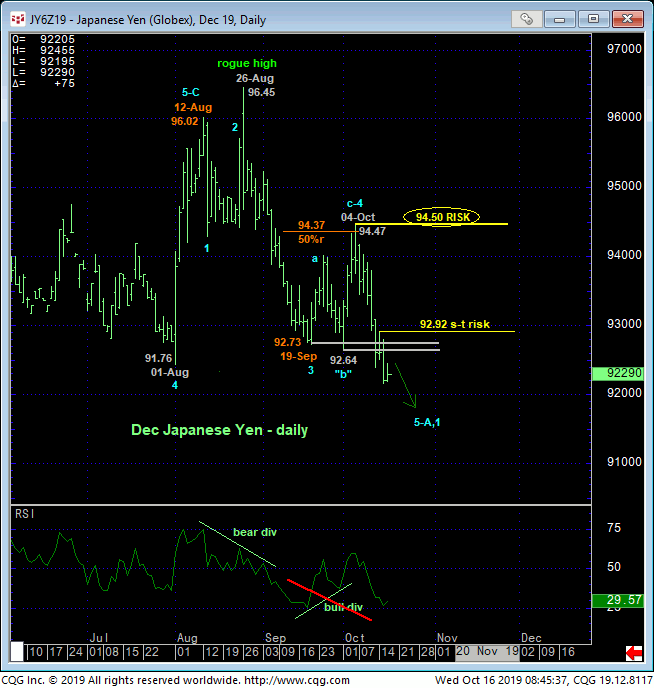
The past few days’ break below 01-Oct’s 92.64 low reaffirms our major peak/reversal count and leaves smaller- and larger-degree corrective highs in its wake at 92.92 and 94.50 that are now considered our new short- and longer-term risk parameters from which a bearish policy and exposure can be objectively rebased and managed. Former upper-92-handle-area support is considered new resistance ahead of further and possibly protracted losses straight away.


This resumed weakness below 92.64 nullifies 03-Oct’s bullish divergence in momentum and chalks up that recovery attempt as a mere correction within what is now a 2-month downtrend from 12-Aug’s 96.02 orthodox high that we believe is only the early stages of a major peak/reversal process similar to Mar’18 and Jun’16. This bearish count remains predicated on:
- early-Sep’s bearish divergence in momentum
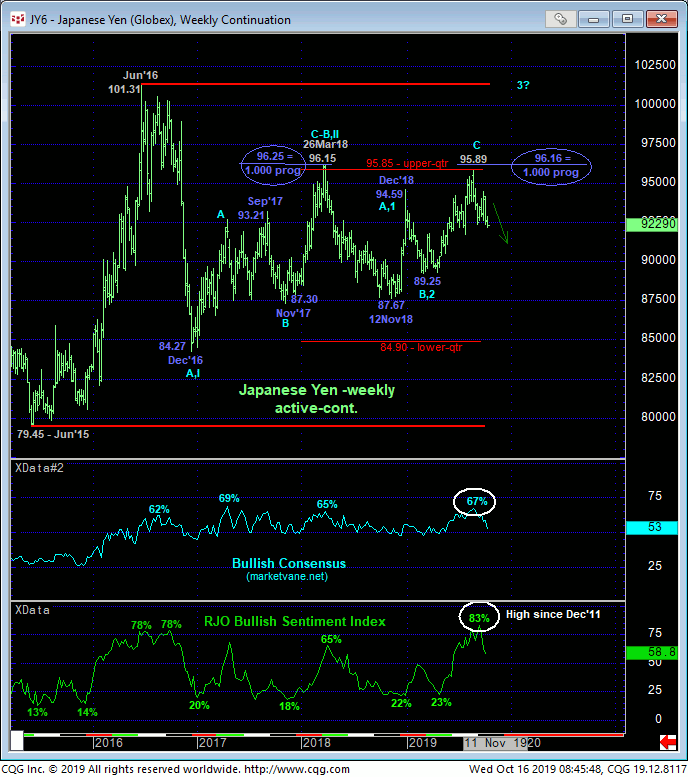
- the market’s rejection (again) of the upper-quarter of the past three years’ lateral range
- a complete 3-wave and thus corrective structure up from
Nov’18’s 87.67 low where
- the suspected c-Wave from 89.25 was virtually identical in length (i.e. 1.000 progression) to Nov-Dec’18’s preceding 87.67 – 94.59 (A-Wave) rally
- historically frothy bullish sentiment levels DESPITE the fact that the market was still trapped within a major, multi-year lateral range!
We believe this last contrary opinion bullet point is the most indicting of a major peak/reversal count because it provides tremendous fuel for downside vulnerability. If correct, we believe this count warns of a multi-month or even multi-quarter run at the lower-quarter of the 3-year range down around 85.00 or lower.
These issues considered, a bearish policy and shorts from 93.50 OB recommended in 09-Oct’s Trading Strategies Blog remain advised with a recovery above 92.92 required to pare or neutralize this exposure commensurate with one’s personal risk profile. In lieu of at least such 92.92+ strength and preferably a recovery above 94.50, we anticipate protracted losses straight away.


