As we venture into the 4th Quarter of 2018, the U.S. Dollar has fortified itself as a haven of safety and stability amongst the ongoing emerging markets crisis around the world, and furthermore the divergence in growth between the U.S., China, and Europe that began late last year.
The Chinese Shanghai Index peaked in January and has steadily declined to the tune of -21%, and shows no true sign of a bottom – Germany has also been in remission with the DAX -10% since January. In conjunction with Europe and China slowing, the ongoing crisis in EM currencies (see Turkish Lira, Argentinian Peso, Brazilian Real, South African Rand etc.) has contributed to a large flight of capital out of such countries’ currencies and into the U.S. Dollar.
On top of all of this, the United States has seen an ongoing (9 consecutive quarters to be exact) acceleration of growth. The U.S. has been on a historic run, but can it last? Is the U.S. insulated from the rest of the world’s problems, and trade war with the Chinese? We’re starting to fall into the camp that believes the party may be drawing to an end in the near-term. While the U.S. Dollar has enjoyed a more than 10% rally since May on accelerating U.S. econ data, based on our findings and predictive models moving forward, we’re expecting both a q/q and y/y slowdown in the U.S. economy.
Much of what we’ve seen in recent weeks, including an acceleration in wage data, an ultra hawkish Federal Reserve, and an official end to their “accommodative” economic policy at the September Fed meeting – is consistent with late cycle/peak cycle behavior. Whether the USD has seen its best days or has more room to run, is still up for debate as the market trend remains “bullish” and the lagging data still coming in from Q2 and Q3 remains largely positive.
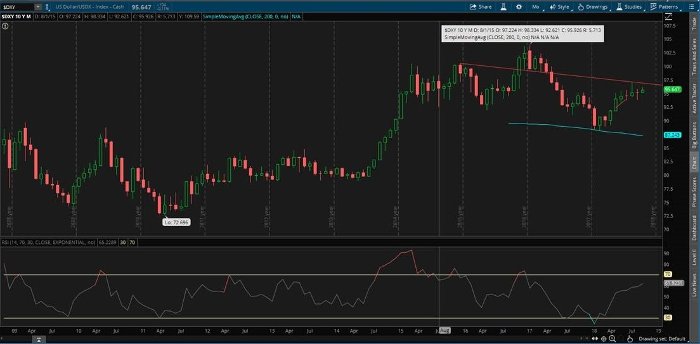
Tops are processes, not specific points, so this is likely not a trade that would develop “overnight”, but the technical view below does look quite ominous with a developing “Head and Shoulders” reversal patter on a 10-year Monthly Chart of the USD. As always, we remain data dependent and will pivot on this call if proven wrong.
10-Year Monthly Chart

CC: ThinkOrSwim


