

By, John Caruso
The average bear market has lasted 289 days with an average price decline of 37.3%, based on data from 19 bear markets spanning 140 years.
Plenty of markets at or approaching range highs/lows and OB/OS in the table this morning that could present some good near-term opportunities. Gold recapturing trend into yesterday’s close was a positive development, and the Dollar taking a breather (remains Bullish trend, and immediate OS). We’ve got a lot of Fed speak today to wade through, with Bullard speaking now (the Fed’s most Hawkish member), followed by Harker, Kashkari, Powell, Mester, and Evans – all very eager to centrally plan your day ahead. Somebody asked the question yesterday, prior to Paul Volker, did anybody outside of Finance know who the Federal Reserve Chairman was? That’s a good question, because our lives have never been more centrally planned in the history of capital markets than they are today. And remember, this year’s “Soft Landing” is last year’s “Transitory”.
Stocks/Volatility: immediate OB readings on all of the major indices this morning, but still room to ride a little higher in my range. 4147, 12878, and 1861 are the range highs in SP500, NQ, and Russell respectively. IVOL discounts are beginning to build again, expressing market hedges have been coming OFF over the last 2 sessions – discounting more downside essentially. That’s always been a personal favorite indicator, as you know. VIX is at 26.50, and running out of room on the downside – with immediate upside to 36.86.
Bonds/Credit: Bonds are clearly acting “hyper sensitive” to near-term inflation spikes/events – like what we’ve seen in Ags and Energy. I’m still getting lower high readings in our 10yr yield range – and lower highs in Treasury volatility index (MOVE), but a re-test of 3.10 is certainly a probability. Also notable, for the first time since March we’re beginning to see momentum changes inside of the Bond price momentum signal to NEUTRAL.
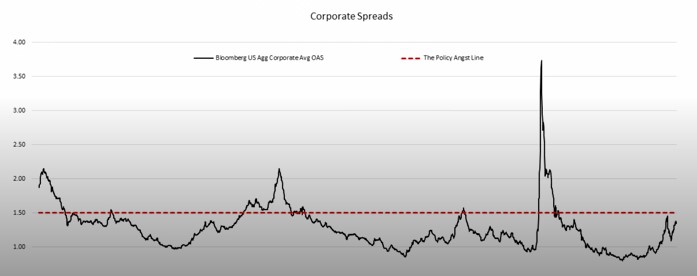
Junk: I came across the chart below yesterday – Corporate bond spreads, or high yield credit spreads. The chart shows the market approaching the “Angst Line” – which of course above it is where High Yield Bonds begin to show signs of corporate default risk due to tightening credit. If you need a better assessment of this market, pull up HYG on your platforms at home and ask yourself whether that looks like a healthy situation.
About John Caruso
Follow John on Twitter @JCarusoRJO. John began his career at Wilshire Quinn Capital, a Wealth Management Firm based out of Los Angeles, California. John made his move to the commodity industry at the end of 2005, and began his path at Lind Waldock, at the time the largest retail brokerage division worldwide. John did his undergraduate work at Robert Morris University in Pennsylvania from 1999-2003, where he was a 4 year varsity basketball letterman. A self-professed “Macro Trader”, John uses a multi-factor fundamental and “quantamental” trading model in distinguishing market cycles based upon the accelerations or decelerations of growth and inflation metrics. His technical and quantitative approach is heavily reliant upon trend and market range analysis via a custom built standard deviation system in helping him make probability-based market decisions. John is an avid reader of all things pertaining to finance, and behavioral economics. Click here to sign-up for John Caruso’s Trading Coach Insights. Daily information and insight on all futures marketsin ranging from metals to equities.
