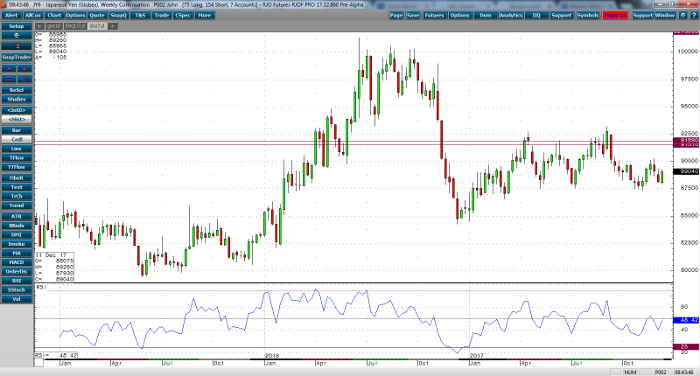
I’ve written about the Japanese Yen for the past few weeks and its ability to survive this endless run higher in both US and Japanese Equities. As we all know, the Japanese economy carries an outrageous Debt to GDP ratio which has largely turned off speculators in the long Yen vs. USD trade. However, recent GDP and Inflation readings are suggesting there may be some value in Yen moving forward and may be able to regain some “safe haven” status in the New Year.
Japan GDP:
Q/Q: 0.6% vs 0.3% prior
Q/Q SAAR: 2.5% vs 1.4% prior
Year/Year: 2.1% vs 1.7% prior
Japan Producer Price Index:
Month/Month: 0.4% vs 0.3% prior
Year/Year: 3.5% vs 3.4% prior
From a technical perspective, the Yens ability to hold its long-term trend line support line at the 87.50 – 88.00 area, also keeps me interested in trading the upside in early 2018. While we’ve largely been trading sideways in Q4 ’17, and we may be near-term overvalued at present levels (89.65 March basis) we’ll keep an eye out for Key Support at 88.30-88.00 (March basis) for bullish opportunity’s in the Yen.
Japanese Yen Weekly Chart


