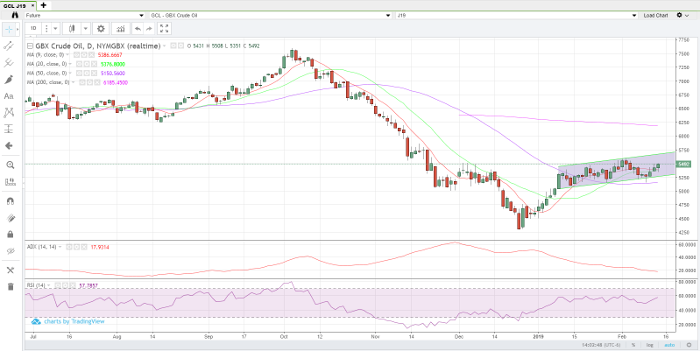
Crude oil has been in a sideways, ever so slightly bull channel, trading range for over a month now and on several occasions has appeared to try and break out both to the downside and the upside but to no avail. Over the last week of trading the market wants us to believe its ready to try and breakout to the upside again. Will it happen? The fundamental picture remains pretty much the same – questionable economic data suggesting a possible global slowdown, ample supply and soft demand, the classic fundamental story of any bearish market and yet the market hasn’t collapsed. Today’s weak retail sales data once again helped confirm fears of a weakening economic picture. In addition, we continue to see a strong U.S. dollar which puts pressure on commodity prices in general. Refinery capacity utilization remains weaker than year over year currently at 85.9% vs. year ago levels at 89.8%. This is interesting as it gives the market lots of room to ramp up demand for oil. Current stocks of oil stand at about 451.8 million barrels which is 28.7 million barrels more than last year this same time and above the 5 year average of 427.1.
Short-term technical indicators suggest a weak uptrend approaching overbought territory. There are a few positives as price action is back above the 9-day moving average and it would appear the market has been forming a base with the tight, fairly sideways, month long trading range.
Crude Oil Apr ’19 Daily Chart


