We’ve had a lot going on this morning, so I’m getting this off a little late – by the way feel free to email me if you need a specific market range at any time and I can get that off to you quickly.
What can say, another great day to be executing on the process of long bonds and gold. I just want to be clear – if our signal changes and suggests a change in our directional bias on any particular market, you will be the first to know! We’re not going to nail every turn in every market at every top and every bottom, so let’s not get confused here. Some calls we’ve made have been early, but we still have the data and signal that supports our bias’. Let’s not let our emotions get in the way of our quantitative and fundamental views of the market. Our model suggest in this economic environment (Growth/Inflation Slowing) – when bond yields are at the top end of the range you should be buying/accumulating treasury bonds, and at the low end of the range in gold (still bullish trend) – buy gold. If you’re looking for a momentum trading model that chases markets high and sells higher– this isn’t it, be better than that. We trade the trend and buy on pull backs to the low end of our actionable range – which is based on price, volume, and volatility.
Moving on…
We’re beginning to see lower highs in our daily ranges in the Stock Index and subsequently higher lows in the Volatility signal via the VIX. 15.00 is a key pivot point for the cash VIX.
We’re still interested in OIL, but from the right price of course. Oil -1.57% this morning and we’ll look for 54.00 as a buy target for Oil. Energy related stocks and energy commodities remain one of our models favorite asset classes moving into Q2 2019.
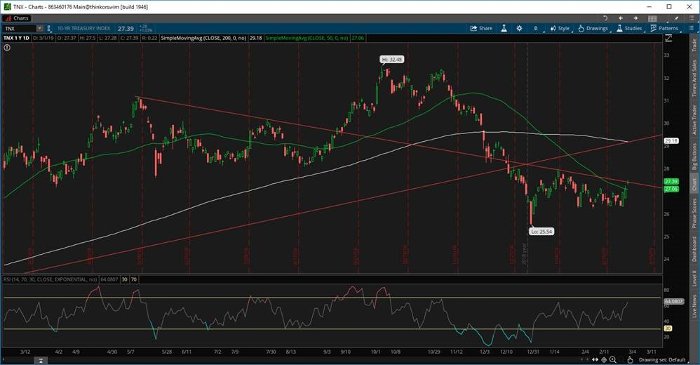
The manufacturing data slowed m/m. And we still firmly believe the biggest move to capitalize on this week into next is bonds as yields have moved to 2.75%.
Here’s the daily chart of the TNX – Tracking Bond Yields – Maybe this gives you a better view of whats been happening with Interest rates since everybody bought the highs in yields (sold the lows in Bonds).

Actionable Ranges:
|
Market |
Trend |
Range Low |
Range High |
|
|
|
|
|
|
SP500 |
Neutral |
2716 |
2810 |
|
Nasdaq Comp |
Neutral |
7351 |
7585 |
|
10yr Yield |
Bearish |
2.61% |
2.74% |
|
VIX |
Neutral |
13.41 |
18.19 |
|
Oil |
Neutral |
54.33 |
58 |
|
Nat Gas |
Bearish |
2.62 |
2.91 |
|
Gold |
Bullish |
1308 |
1352 |
|
USD (Cash) |
Neutral |
95.62 |
9702 |
|
EUR/USD |
Bearish |
1.12 |
1.14 |
|
USD/JPY |
Bullish |
1.1 |
1.12 |
Feel free to reach out to John Caruso at jcaruso@rjofutures.com or 1-800-669-5354 if you’d like to get a 2 month free trial of our proprietary trade recommendations by email.
Also, be sure you sign up for our exclusive RJO Futures PRO simulated demo account here.
RJO Futures PRO Simulated Account includes:
- -$100K simulated trading capital
- -Live Streaming Quotes and Charts to help you test out your trading abilities in real-time.
- -Access to our Professional Trading Desk for advice and free daily research.


