Stocks- As we mentioned yesterday, we’re immediately signaling oversold/bullish trend on all 3 of trend durations we look at. Our 3-6 month Bull/Bear line comes in at 3137. Sustained price action (3 days closing below t3137) flips the chart to Bearish on a 3-6 month basis. Relax though, we’re not there yet, but as I’m sure you know, risk happens slowly and then all at once. So be careful out there as we embark on Scenario 4 in the Growth/Inflation Model headed into Q2 2020 (April 1) – Growth and Inflation both slowing simultaneously – which by the way we’re already beginning to get a taste of in commodity prices. Rising probaility we “Short” Equities on the next bounce to the top of our range (3303 SP500).
FOMC- We’re of the opinion that the Fed won’t be Dovish enough tomorrow. But will soon be. Q4 GDP is released on Thursday, 1 day after the Fed, and will likely see a suffer a major rate of change slowdown. The Fed will eventually come our way, meaning they’ll have no choice but to bang the gong for more rate cuts and dove-speak.
Currencies- Our favorite as we speak is the UKs British Pound. With better Employment and PMI data recently released, the BREXIT outlook seemingly becoming more clear by the week, and Boris Johnson considered a “pro business” Prime MInisister – we think the Pound could be a top performer this year vs the USD. Also, with the UK seeing heavy divestment from foreign investors over the past 3 years due to the uncertainty of BREXIT, we think that’s likely to change as we move past Jan 31st– the official BREXIT day for the UK. British Pound is trading at 1.3014 this morning with the Bank of England set to meet on Thursday and BREXIT Friday.
If theres any uncertainty surrounding the Pound in the near-term – it lies within the BOE monetary policy decision on Thurs. There’s been talk they could cut rates, but I’m based on the recent strength in UK data, we think they likely take a “wait and see” approach to interest rates and hold steady.
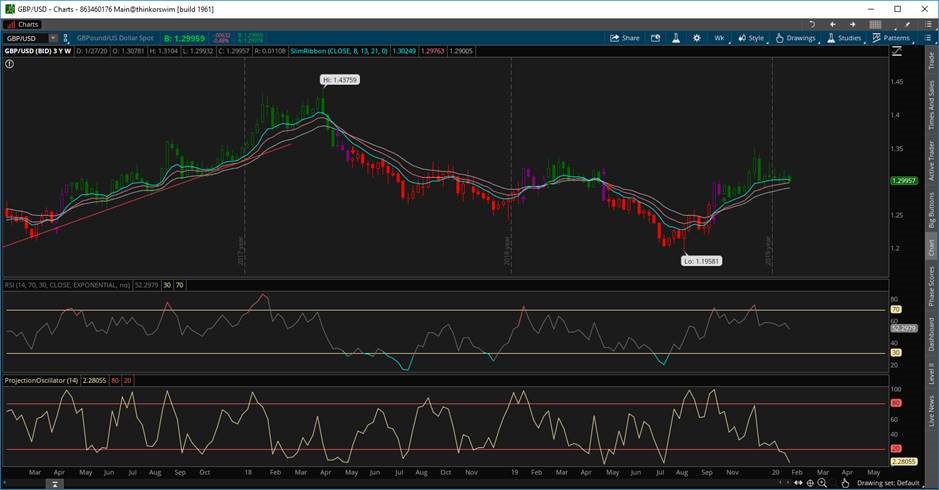
GBP/USD Weekly Momentum Chart – 13 consecutive weeks of Bullish Momentum vs the USD and now signaling OVERSOLD with Bullish Momentum – indicated below by the projection oscilator breaking below 20 (bottom line chart)
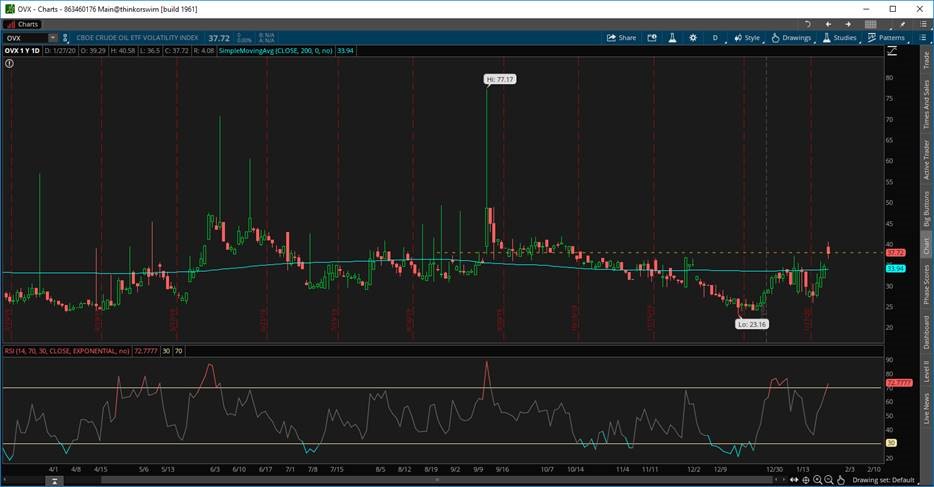
Oil- A terrible place to be the past 2-3 weeks, following it being the best place to be in Q4 2019. What we’re watching closely is the OVX (Oil Volatility Index) – sustained price action north of 38.00 (the dotted line below) is BEARISH for Oil prices. As you can see, it’s been sub 38.00 since the beginning of October. What we’re looking for another dip below, allowing some reprieve back to the upside for Oil prices to trade out of this mistake. I think we’ll get that look, so bare with us.
Breakout in OVX – Oil Volatility – A Warning sign of Oil Bulls