
As mentioned yesterday, we thought an attempt at a rally was likely this week in stocks. The top end of my range in the SP500 is at 2830 and remains “Bearish” Trend but teetering. A re-test of the most recent lows we believe is highly probable in coming sessions/weeks – we’ll remain vigilant in US equities. Some noteworthy action in today’s tape remains bonds and bond proxies – 30yr and 10yr yields are flat to down, paying no respect to this rally in stocks. Gold also remains buoyant, strapped to the top of our range and teetering our “bull/bear” line of 1229.00.
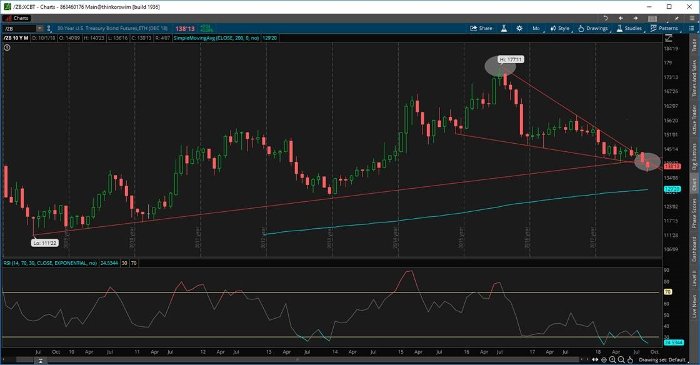
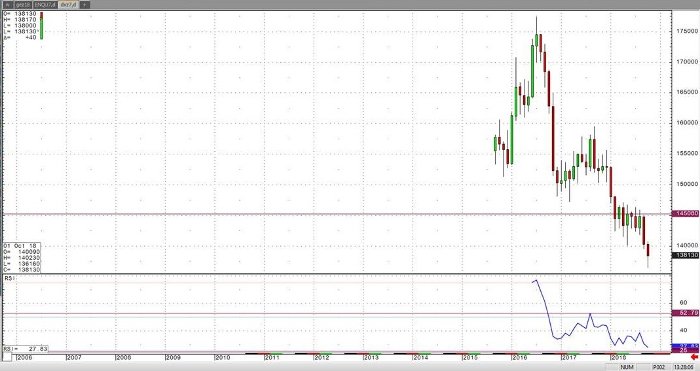
Back to Bonds, I’ve had a lot of pushback on this call that we made in Aug/September about starting become bullish in the Bond space, and rightfully so. The chart is dreadful and has been for nearly 2.5yrs. But take a look at how wonderful the chart looked in July of 2016 – just ahead of the massive wave lower in price and the steady climb in interest rates. Many of you were with us back in early 2015 when we made our “bullish” call on bonds and stayed with the trade until the spring of 2016. I realize this is a very difficult call for many to buy into, especially when the white hot LAGGING data suggests otherwise and oh yea, the “chart”. We’re no longer concerned with previous quarters of 2018 – we’re operating in Q4 and the base effects suggest the y/y comps are only become more difficult from here on out. I’m not the “bond king” – and speaking of Jeff Gundlach, who’s all of a sudden pivoted back to bullish rates as of 2-3 weeks ago – was calling for the possibility of a squeeze lower in rates/higher in bonds just 6 weeks ago due to the massive short position in the 10yr notes. Good for him, it’s easy to be right when you’ve got both calls on I suppose. When you’re studying macro based trends, you need time, space, and patience. No doubt we were early with the call, but we don’t think we’re going to be wrong!
Oil – Still bullish trend but bearish trade (3ks or less). Longer term supply/demand factors are lining up bearish – per our sources, BUT – My energy analyst suggests we could see a rebound in prices following another test of $70.00 bbl. Based on the intermediate and longer term trend (which are bullish) don’t be surprised if we fire out a “Buy” signal in the energy space by the end of the week. We’ll keep you posted following the EIA on Wed.
Tomorrow – The FOMC minutes release will be out at 1:00 pm CST. I expect them to express a “hawkish” Fed. All in all, these are based on the Feds hawkish September meeting.
Monthly 30yr Bond chart on a 10 year lookback – Note how “awesome” the chart looked back in July of 2016 – hope you didn’t get bullish bonds/bearish rates then!
30-Year Bond Chart


*Credit to Think or Swim on Charts.
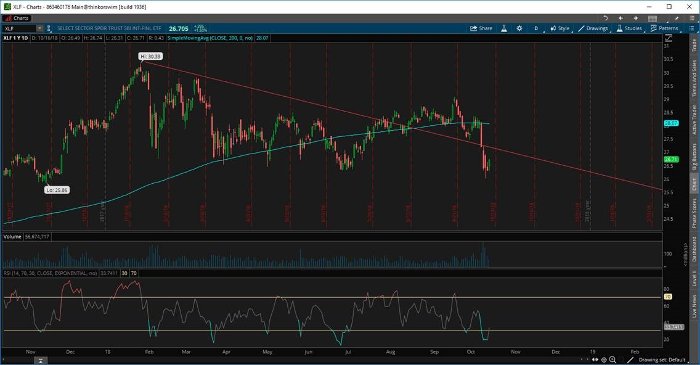
Lets also check in on the financials quickly – Still UGLY!

Feel free to reach out to John Caruso at jcaruso@rjofutures.com or 1-800-669-5354 if you’d like to get a 2 month free trial of our proprietary trade recommendations by email.
Also, be sure you sign up for our exclusive RJO Futures PRO simulated demo account here.
RJO Futures PRO Simulated Account includes:
- -$100K simulated trading capital
- -Live Streaming Quotes and Charts to help you test out your trading abilities in real-time.
- -Access to our Professional Trading Desk for advice and free daily research.


