Buy the damn dip!?
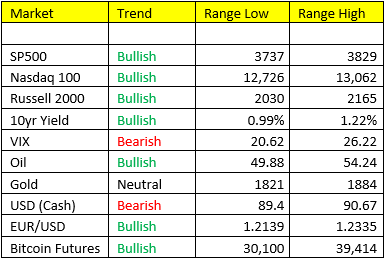
Stocks- pulling off this morning, a well deserved break by the bulls. We’ve got downside in the S&P 500 to 3737 with a compressed volatility index. So long as the VIX remains bearish trend, S&P 500 bullish trend, and within Scenario 2 G/I accelerating, AND the IVOL remains at a heavy PREMIUM (which of course says the market is FEARFUL and hedged for downside risk….we fade that action – we’ll be buying the damn dip. Same goes for the Nasdaq. Wonder why the Russell is setting the pace? That’s an easy one…A. The bastards of 2020, are now the darlings of the reflation trade. B. 26% of the Russell Index consists of bank and other various financial stocks and we all know what financial love….Rising Yields! Banks borrow at the short end of the curve via the Fed overnight lending rate of 0.00-0.25% and lend to the private sector at the long end of the curve via 10yr – 30yr loans. I haven’t sent an index signal out in a while, we’ve been doing well playing the commodity and bond game, but I’m warming up to it.
Bond Yields- I pressed some of our shorts in bonds yesterday, we’ll see how that works out. I think it’s going to workout very well, so long as A. Scenario 2, B. rates remain bullish trend, and C. the stock and commodity bull persists. There will be rallies in bonds throughout the year, but likely within their bearish trend, but we think the 30-35 some odd year Bond bull market is sinking slowly but surely. Honestly I think the Fed wants a steeper yield curve for the health of the banks and also to attempt to stave off any potential for rampant inflation coming down the road. Remember, the new administration, although they’ll never admit it, subscribes to modern monetary theory. Deficits are no big deal and a net positive for the private sector so long as inflation doesn’t become a problem….and remember the Fed has the ability to manipulate the yield curve if necessary to fight inflation.
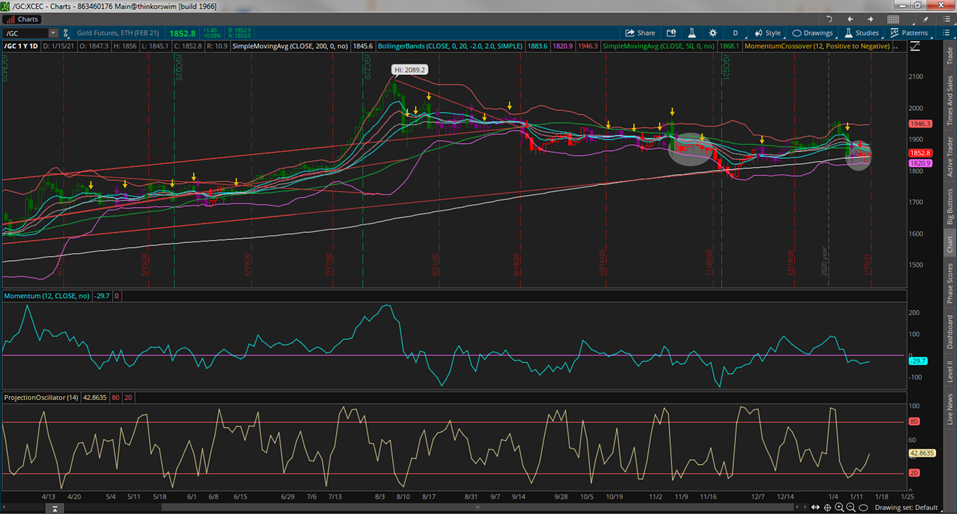
Gold- not doing anything here, as a matter of fact I’ll probably short it if it gets to the top of my range. That’s it….it’s neutral trend, likely range bound for now. It gets ugly if it breaks 1816 from our assessment. If I may, let me share the below chart with you, that show’s two highlighted areas on the chart that look eerily similar, which is why Gold is a risk on the long side that we’re not willing to take:
Disclosure: I’m not a technician so…. 😊 and I know some of you are, so bear with me here….
So you’ve got the break down candle in both of the highlighted areas – we went from bullish (green candles) momentum straight into bearish momentum (red candles). In the first highlighted area from mid-November, you see the breakdown, then about 6/7 trading sessions of sideways action, followed by another 100 point drop. The right shaded area looks to be the same, could this time be different ABSOLUTELY, but this pattern looks unresolved and way too risky for my taste. Besides being in the wrong Scenario, and Neutral trend….Hopefully this further clarifies my stance on gold for the moment.


