Last week was not up for debate – purely risk-off across all assets. The SPY and NQ lost -4.8% and -4.6% respectively, and the CRB (Commodity) Index was -4.00% with Oil being its largest weighting. If you’re like me, you can take advantage of counter-trend moves within that type of trading tape – we chose to buy Gold (-1.4% w/w) but still holding its bullish trend (we covered Gold when it was +$18 on Friday).
Probably the most noticeable divergence in risk assets last week was the massive divergence between Stocks and Interest Rates. Stocks finished on their lows of the month, while Interest Rates finished on the highs (Bond prices on the lows) – Stocks and Bond prices typically carry and inverse correlation. So while we claimed last week as a Scenario 4/Risk Off week, we didn’t see that manifest in the Bond market (bonds are typically a top LONG position in Scen 4). I’m not going to really argue with the tape in this case, randomness is something that everyone needs to take into account (AND EMBRACE) when you’re playing this game. I’d imagine more evidence will emerge throughout the week and clearer path forward will emerge.
SPY -4.8% w/w – signaled immediate oversold on Friday with a neutralized trend and broke to a negative momentum set-up on Wednesday.
USD +1.1% w/w – broke higher on safe-have demand buying. Just flipping to positive momentum as of this morning – but immediate OB/top of range.
Gold -1.4% w/w – negative momentum set-up, but bullish trend and signaled immediate OS. I suggest waiting before taking the plunge back into Gold on the long side.
Oil -10.0% w/w – we initially viewed Oil over the past 2 weeks as setting up for a more positive period, the market disagreed. Momentum broke “bad” on the weekly chart, and the chart is in free-fall. Covid-19 shutdowns and demand fears gripped crude.
Volatility- VIX and VXN both broke north of 40.00 last week. Godspeed to the Robinhood traders when that happens. Those levels of volatility make it damn near impossible to “pick stocks” or “But the F-ing Dip” in equities. I don’t know where volatility goes from here. Volatility is episodic, clusters, and is usually non-trending. I’ll continue to measure volatility within our bull/bear model to make decisions on our next move in the Equity Indices.
Tuesday: Election
Wednesday: FOMC Meeting
Friday: Non-Farm Payrolls
That’s a big “Oooooh boy” – (I stole that from a former floor trader/broker I came up with in the business – Jeff F)
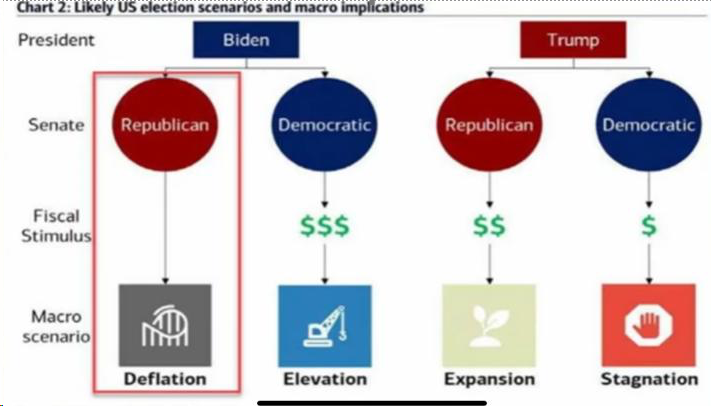
Here’s a pretty cool chart courtesy of Morgan Stanley via Zero Hedge as it pertains to the macro result of potential election scenario’s:
Key: $ denotes the probability weighting of the outcome