

I’m not sure what the narrative is going to be, all that I know is that there will be one….
Studying macro cycles for 2 decades now, it’s funny how the “news” and “narratives” presented on CNBC and in the WSJ seem to always fit perfectly to the tune of markets. When we make a call for “Scenario 4”, its not because we’ve reached into our bag of “narratives” and pulled one out and said LOOK, here’s the political or geopolitical reason why we’re making this call. Absolutely not…It’s the data, it’s always about the DATA, and the news, coincidentally just some how ultimately cozies up right next to it. Whenever we’ve been wrong on calling a turn in the cycle, it’s not because our “narrative” is incorrect, it’s because the incoming data doesn’t match up with our forecasts, and back tests better or worse on a 1 yr and 2yr lookback. Yes I said we’ve been wrong in the past, and we’ll be wrong again – have you ever heard another financial asset manager say that before? Certainly not on CNBC or Twitter that’s for sure, where everyone’s batting 1.000% of course (at least we’re showing our work). This is why our process is multi-faceted. We’re consistently checking not only our view of the market cycle as it relates to the incoming data, but also our quantitative methods in measuring multi-duration trend changes in markets. 9/10 times the quantitative signal turns first, followed by the data, i.e. a bullish to bearish or bearish to bullish phase transition.
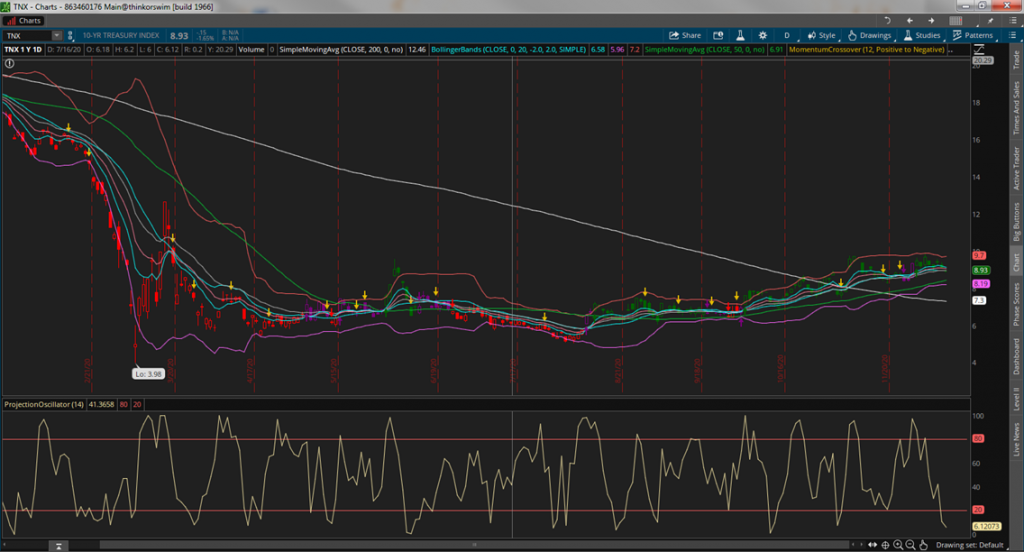
Speaking of bullish to bearish phase transitions, here’s a look at the 10yr yield with some bullet points below of what we see…..
*First thing you notice is probably the massive drop over the past 2yrs from the cycle peak of 3.25% in Q3 of 2018. Yes Q3 2018 was when the cycle peaked in bonds and subsequently the economy.
*Secondly, the range analysis shown, which is a reflection of price and volatility….you can see how wide the ranges were on the left side of the chart – that’s sign of elevated volatility which is a BEARISH indicator for price…we all knew that though.
*Third, check out the momentum indicator, which changes from Red (Negative) to Purple (Neutral), to Green (Positive) coupled with a NARROWING range….hmm, how about that. Not to mention the trend has also shifted to now pointing (albeit slowly) to the upside. Turns in the bond market are like an Oil tanker turning in the ocean…it happens very slowly and then it begins to happen faster. Risk happens slowly and then all at once – a mentor of mine once issued those words, and I believe them never to be truer than in this case right now.
*Finally, the bottom chart is an OB or OS indicator, which you can clearly see is well below the OS line (6.12 to be exact). So putting this all together, I’m reading this chart as, wait for it….
BULLISH TREND, BULLISH MOMENTUM, AND IMMEDIATE OVERSOLD….AND falling Volatility! Yes I would short more US Treasuries right here, right now.
This was all for the purpose of showing some my work. I know its hard to simply just take my word for it, especially for our newcomers, but this is just a small part of what we do in terms of studying quantitative signals,…getting the Growth/Inflation cycle can be much more tedious and tricky, and requires a lot of “nose to the grindstone” style work. But as a former athlete, I know that anything that is hard, or tedious….is usually the best thing for you. As Ray Dalio would say….Go towards the PAIN!
That’s all…Good luck…..I’ll get the ranges out soon!
