

I was reviewing our call on inflation from back in September, and aside from perhaps being off by a few percentage points – our overall theme of declining consumer and producer inflation has largely been correct. Now we won’t be taking a victory lap on this call because to be quite honest it wasn’t all that difficult to make. Inflation peaked over the summer of 2022 at 9.1% and shortly thereafter economic gravity began to take shape. The Federal Reserve began raising interest rates to combat runaway inflation in Q1 2022, and to date they have raised 475bps of the fed funds rate from the 0.00 bound in late 2021. As we update our report today, the Fed is on the brink of perhaps delivering its 500th basis point of rate increases in just a 13 month window – a very aggressive pace to say the least. Our current economic outlook over the next 6-12 months or 2-4 quarters is for further declines in consumer and producer inflation which will largely be sponsored by a lower economic growth environment, a decline in M2 Money Supply, tightening credit, declining transportation costs, and lower food and energy prices. Housing, rent, and shelter costs have remained “sticky”, but are largely viewed as lagging indicators and may take more time to catch up as Fed rate increases work through the system. Our median growth forecast for Q1 and Q2 2023 is for -1.98%, and for the Bureau of Labor Statistics to be confirming a recession by Q3 2023. Our first half of 2023 (Q1’23 and Q2’23) outlook for inflation is one that is still of the “sticky” variety, but ultimately a slowing of y/y headline inflation to an average of 4.95% (this estimate is lower than our forecast of 5.75% in Sept 2022).
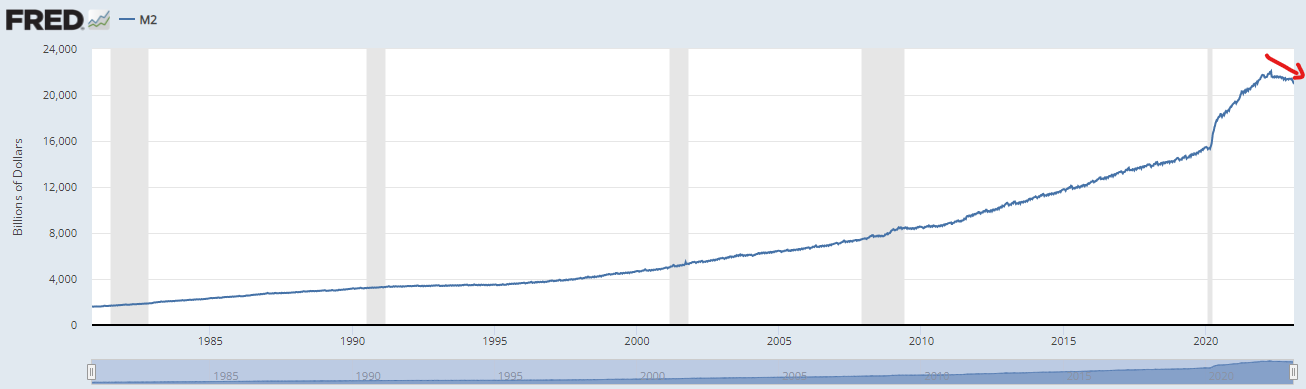
- M2 Money Supply:
Notes: M2 suffered its first decline on record (dating back to 1955) aka the “negative wealth effect” induced by Fed policy
*Chart St Louis Fed
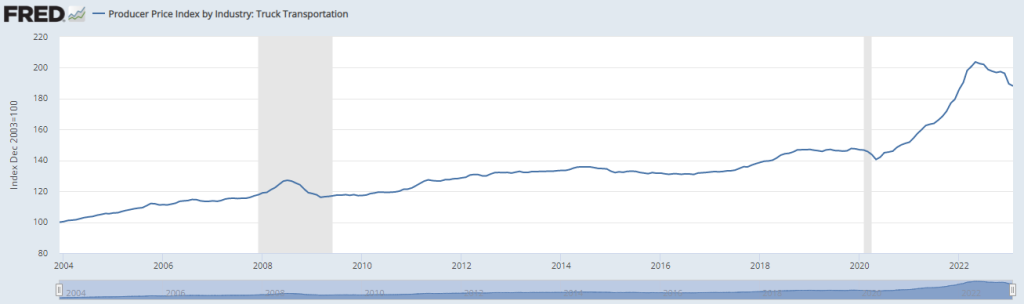
- PPI Truck Transportation:
Notes: a fairly notable decline in transportation – grey shaded areas are periods of US economic recessions (2008 and 2020), and the current flow of this chart is inline with our recession call for the USA in Q3 2023.
*Chart St Louis Fed
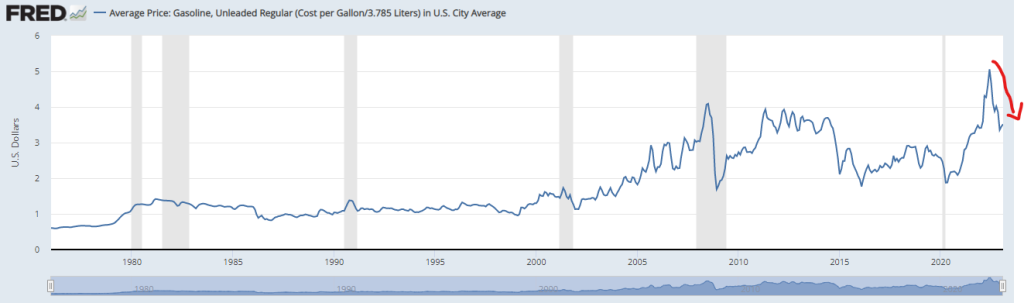
- Gasoline Costs in US City Average
Notes: Gasoline prices -28% y/y
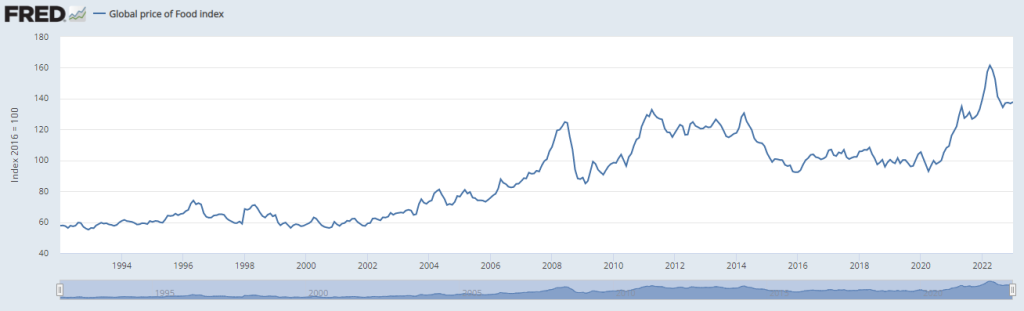
- Global Food Prices
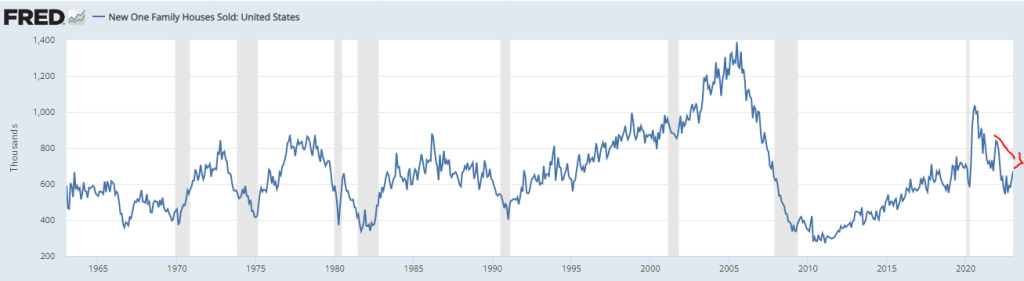
- New Single Family Houses Sold in US
Notes: Housing has been slowing since mid-year 2022, but has since tapered off, but housing remains BEARISH trend alongside higher interest rates
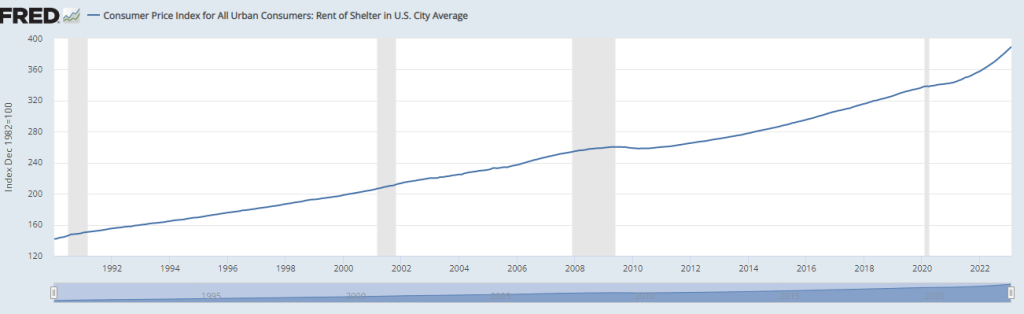
- CPI Rent of Shelter In US City Average
Notes: Rent of shelter costs remain sticky and still rising, but should begin to level off if/when the labor market begins to ease.
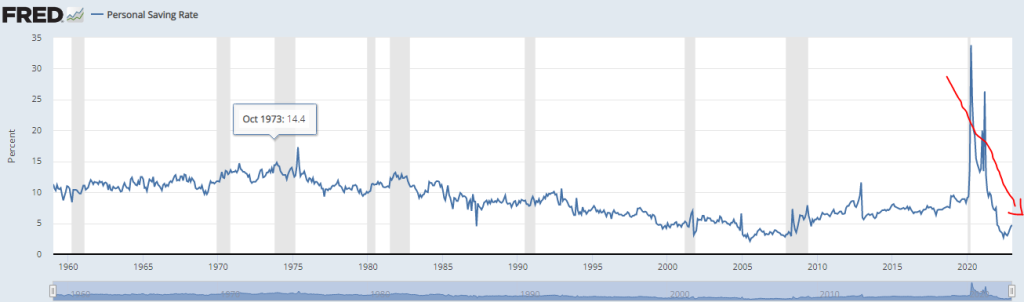
- Personal Savings Rate:
Notes: Savings have declined to levels unseen since the 2008 GFC recession. Further evidence that households are likely at or in the beginning stages of pulling back on discretionary spending.
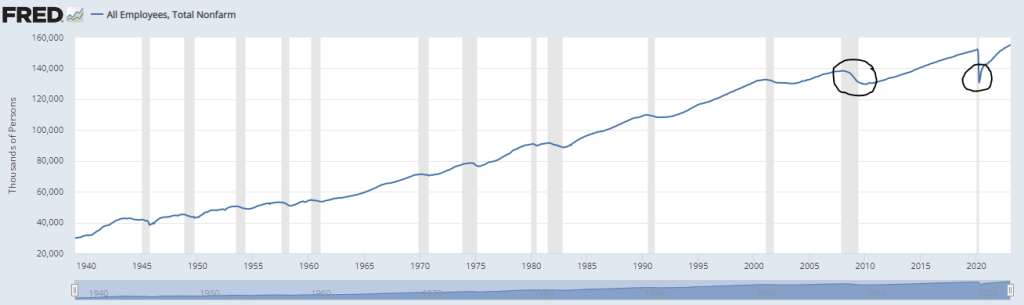
- All Employees, Total Nonfarm
Notes: the tight labor market conditions have undoubtedly contributed to elevated levels of inflation – unfortunately we do believe these figures are about change for the worse in Q2 2023. One of the last “shoes” to drop ahead of an oncoming recession is labor. The labor market also historically lags broader economic conditions by 12-18 months!
Conclusion:
Lower growth, tightening credit, further degradation of the corporate earnings and profits cycle, and a lower employment environment in the United States and abroad should further contribute to a declining growth and inflation environment over the next 6-12 months. Our current call is for a recession to be confirmed in Q3 2023 by the BLS, and for us to be coming out of recession by Q4 2023 to Q1 2024. Another space to monitor in coming months are potential stresses inside the Commercial Real Estate sector. With a record number of commercial mortgages expiring in 2023, this may further test the health of the financial and banking system. Most recently we’ve seen banking liquidity issues in the regional banks of Silicon Valley Bank, Signature, and First Republic Bank, as well as abroad from Credit Suisse. These are clear signs of stress in the financial system, and further evidence that the Fed’s rate hikes are now just in the beginning stages of taking effect. Smaller regional banks hold approximately 2.3T in commercial real estate debt which is nearly 80% of commercial mortgages held by all banks. If a large number of these properties go into default it could force banks to mark down the value of assets held on their books. We’re not sounding the alarm bells on this just yet, but it’s certainly something to guard against. The current macroeconomic backdrop of the market is on that is susceptible to further shocks and surprises to the financial system. We make no prognostications around potential “black swans”, but with the tight credit conditions being felt as a result of the Fed’s aggressive and brisk pace of rate hikes over the past 12 months, we recommend that you keep your investment decisions conservative in nature.
Recommendation:
Over the duration of the Q2 we recommend remaining defensive in posture and tactical where your see fit. Underweight exposure should be in US Equities/Commodities vs Overweight exposure in Cash, Treasuries/fixed income, and Gold. US Treasuries we believe have become “investible” again since the turn of 2023 with very attractive yields across the curve.
Consult your RJO Senior Market Strategist to discuss current market opportunities as well as appropriate trade strategies that meet your risk/reward goals.
DISCLAIMER:
The risk of loss in trading futures and/or options is substantial and each investor and/or trader must consider whether this is a suitable investment. Past performance, whether actual or indicated by simulated historical tests of strategies, is not indicative of future results.
