

*JOLTs 10.717M vs 10.0M exp (not going to help the “Fed Pivot” camp with this number)
*FTX Crypto Exchange collapses, exposes potential misappropriated customer funds
*China’s Guangzhou locks down another district on Covid
*BOE: More rate hikes likely to come
*US CPI Y/Y declines to 7.7% (8.2% previous); 6.3% Core (down from 6.6% previous)
*GER CPI 10.4% y/y vs 10.0% previous
Market Performance:
SP500 +6.62% w/w
NASDAQ +9.7% w/w
10yr Yields -34bps w/w
USD -1.04% w/w
Gold +5.7% w/w
Silver +6.2% w/w
Oil -2.3% w/w
Commentary:
Last week was fairly mundane until the release of the Oct CPI data on Thursday. Oct CPI saw a sequential decline m/m (0.4%) and y/y (7.7%) in both headline and Core CPI (6.3%). Bond yields fell aggressively to the tune of -34bps following the release (Bond price rallied to immediate OB), the SP500 charged higher by 5.5% on Thursday alone (to immediate OB), and the US Dollar had a big decline -2.00% placing it immediate OS. The sequential slowdown of CPI was a day we likely knew would come, the mid-terms were in the rearview mirror and traders viewed that as an opportunity to go “risk-on”. While last weeks action may have been viewed as a “breath of fresh air”, and we recognize (and take into account) seasonality factors that support strength in US Equities at this time of the year, I’m going to remain steadfast in my view that the bear market is NOT over – and in fact we did incrementally fade the rally in equities and the sell-off in the US Dollar as we hit some immediate-term extremes in terms of “overbought” and “oversold”. You have to recognize that these macro cycles are running much longer than we’ve seen in previous bear markets over the past decade, and it’s going to take much, much more than 1 single CPI report to stave off inflation and the existing bear forces that are present in the market. But the Bulls had a good week, and are coming into a seasonal period of strength for markets, we’ll see if that’s enough to get them through the next 5 weeks until the release of the Nov CPI data, followed by the Dec FOMC meeting. While seasonal strength seems to be the narrative on Wall Street, I’ll suggest preparing for the next phase of the bear market. Bear in mind, higher asset prices only begets more INFLATION.
Top Headlines/Market Risk
*SA tells OPEC it cut Oil output by 84K bpd to 10.957M bpd in OCT
*OPEC cuts full-year 2022 world oil demand growth forecast to 2.55M bpd (-100K bpd from previous forecast)
*Ukraine’s President Zelensky: We are moving forward and we are ready for peace, peace for all country – strangely post US Mid-Term Elections
Stocks:
SP500 -0.30% pre market on Monday, remains bearish trend, bullish trade (1mo), and carrying an IVOL discount of -32%. We’ve got PPI on deck tomorrow, and Retail Sales on Wednesday. Producer Price Index will be a market mover tomorrow and we may see a fairly quiet today headed into that release.
Oil- largely trapped inside a 93.50-81.50 range for crude since the beginning of Oct. and remains bearish trend. Oil prices had a big test recently at 93.50 and failed before rotating back to mid-range of 85.00. I’m going to give the bulls the benefit of the doubt in Oil (for now), and that we can reattack the 93.50. If Oil prices rotate back down through 85.30, I’d suspect we’ll get another retest of the lower bound of the sideways range at 81.50. Aside from some short 82.00 puts (expire on Wed), we don’t have much exposure to the Oil market currently.
Gold- last week was a big week for Gold as it moved to BULLISH trend in our model. Bullish trend, Positive momentum, but has risen into an immediate OB position. Conversely to Gold, US Bond Yields are signaling immediate OS, and the USD Dollar immediate OS here as well.
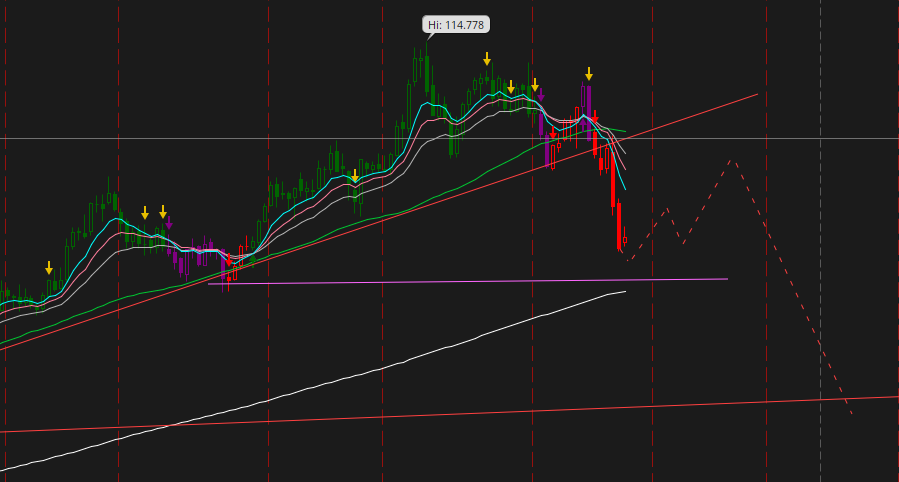
US Dollar- USD had a big break lower following the US CPI Data last week. While the dollar move was notable, the big question here is whether it is “over” for the Dollar’s run. I’ll recognize that the move on Thursday/Friday has all of the makings that could indicate a cycle top is in place, and beginning to price in “peak Hawkishness” by the Fed, I still think you can buy these breaks in the Dollar for long side trades. I’ve got a snip of the Dollar down below and what we likely think happens from here and how this could play out if we are indeed at “peak hawkish” by the Fed:
Dollar Daily Chart : A clear break of the technical near-term trendline, with larger trend support at 105.00. Near-term (daily chart) forces remain bearish that could possibly take us into a retest of 105.00, but long term bullish forces still exist on the both the weekly, and monthly time frames, that will likely move USD back the upside in coming weeks – perhaps around the Dec Fed meeting. We’ll check on this outlook as it plays out.
Good luck out there!
| Market | Trend > 6 mo | Range Low | Range High | Momentum | OB/OS |
| SP500 | Bearish | 3697 | 4024 | Positive | 90 |
| Nasdaq 100 | Bearish | 11,079 | 11,923 | Neutral | 93 |
| Russell 2000 | Bearish | 1778 | 1903 | Positive | 91 |
| 10yr Yield | Bullish | 3.80% | 4.19% | Positive | 1 |
| VIX | Bullish | 22.11 | 28.06 | Negative | 43 |
| Oil Dec | Bearish | 84.65 | 91.12 | Positive | 44 |
| Gold | Bullish | 1682 | 1776 | Positive | 76 |
| USD | Bullish | 106.21 | 110.71 | Negative | 15 |
DISCLAIMER
The risk of loss in trading futures and/or options is substantial and each investor and/or trader must consider whether this is a suitable investment. Past performance, whether actual or indicated by simulated historical tests of strategies, is not indicative of future results.
