

*GOOG misses on eps and rev; -7% pre market
*MSFT slight beat on both eps and rev, warned of slowing growth in Cloud and slowing sales of PCs -6% pre market
*Meta eps 1.64 vs 1.89; 27.71B vs 27.38B exp, Meta shares tanked -23% as Wall Street didn’t like guidance
**AMZN posts worse than expected earnings, dropped -20% in post market trading
**AAPL beats earnings exp but iPhone sales and services came in light
Macro:
*Q3 GDP 2.6% vs 2.3% exp
*ECB raises 75bps (in line with expectations)
*US Pending Home sales declines -10% m/m
**PCE Index y/y 6.2
**Core PCE Index 5.1% vs 4.9% prior
US Equities Commentary:
Ok, so let’s contextualize a little bit (both my video commentary and the data). On the margin we saw plenty of disappointing data last week. However, the SP500 and NASDAQ finished the week with gains of +3.5%, and +1.5% respectively. Pay attention, because the market may be trying to convey a message here and that is one that could suggest a November rally is in store. While I remain predominantly bearish on the economic backdrop both globally and domestically, and any upside from here is likely a weigh station to lower prices out into 2023, I’m a realist. We’ve got plenty of blue chip and tech “darlings” that are down 50-80% YTD. Ask yourself this question, Do I want to be short stocks (and Indices) into that set-up? Furthermore, there’s plenty of evidence out there that suggests the Fed is on the brink of signaling to the market that it will begin to slow its pace of interest rate hikes from here. The question being, will that be enough to spark a rally in stocks? Perhaps it could be, but not likely for anything more than 1-2 months in my humble opinion. Why? Well, from our research we’re coming into the belly of the beast in terms of the corporate profits and earnings recession, and as the old saying goes “first earnings go, then the economy goes”. Economic conditions are rapidly deteriorating as shown in the recent ISM data falling below the 50 mark (sub 50 signal contraction in manufacturing and services industries). The housing market has all but come to a full stop with the 30yr mortgage nearing 7%, and still yet the unemployment data hasn’t even begun to show signs of cracking, but that’s usually one of the last shoes to drop. So to wrap this diatribe up, based on the amount of “pain” markets have suffered over the past 7 months with nothing but bad news, high inflation, geopolitical strife, and on top of all of this a hawkish fed – we think a relief rally could be in store pending Jay Powell confirming a subtle “pivot” in terms of slowing the pace of rate hikes from here. With all of that said, higher stocks beget a weaker USD, weaker bond yields, and more upward pressure on commodities and ultimately INFLATION. The bear market is not over, but it may hibernate.
Interest Rates:
Reprieve on deck? Perhaps. But it is going to take a hell of a long way down for rates to break my “bullish trend line”. Regardless, if we can advocate for a rally in stocks for a trade from here, I can certainly get on board with a move lower in bond yields (higher in bond prices) FOR A TRADE.
To conclude: bearish rates (bullish bonds) for a trade (1 month), we’ll wait and see over the intermediate-term to long-term. Long bonds are eventually where I’ll likely want to be as the economy deteriorates and the Fed has to pivot further, and begin discussing rate CUTS – Yes, that’s where we think this is likely headed out into 2023. All eyes on the FOMC on Wed.
US Dollar:
The dollar suffered a pretty good hit last week, -1.00%. The USDs inverse correlation to the stock market this year is nearly 99% – stocks down/dollars up. I’m of the belief you can buy stocks and dollars together here as a hedge, overweight stocks in the near-term. The dollar rally is likely not over, but is certainly coming off the boil at the moment, and may have some further ground to test lower (if stocks want to move higher).
To conclude: The FOMC meeting release on Wednesday will be a factor in driving near-term moves in the Dollar. Bearish for a trade near-term (1 month), bullish over the intermediate term (3 month), Bearish over the long-term (> 6 mo.) Recognize that the Dollar may be in a topping process, however this 2 week reversal is to minute to fully conclude that. The USD will remain very sensitive to Fed language and very data dependent.
Gold:
Key levels remain 1620 and 1680. A break through 1620 should carry Gold back into the high to mid-1500s. A break above 1680 we think unlocks $50 in upside price potential. All eyes on the Fed and the US Dollar (and Gold) reaction. Gold ultimately remains BEARISH trend, and carrying NEGATIVE momentum.
Oil:
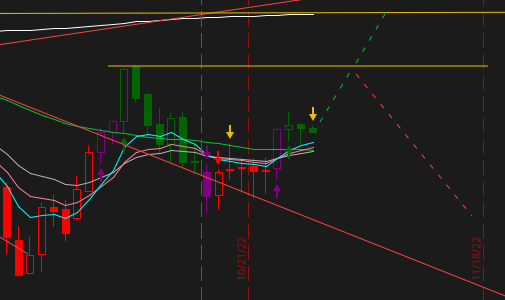
From a technical view Oil prices look to be in a minor rising phase with positive momentum. We saw consolidation around the 85.00 level for approximately 6 sessions, followed by a breakout higher to 89.00 this past week. The next logical level of resistance comes in between 92.00 and 93.59 (the October 10th highs). If price can push through those levels, the next weigh station is likely 97.45 (the August highs). A break down in Crude happens if price breaks back under recent swing lows of 82.00. I’ve got it drawn in on the chart below, with 3 possible scenario’s. 1st a test of 92/93, 2nd a rejection of 92/93 and move back down towards swing low levels, and 3rd a resumption higher from 92/93 to 97.75. I remain bullish on Oil over the very near-term, and watching for tests and or rejections of the levels we’ve just discussed.
An up close look at Oil and trade levels:
As you can see, the conundrum (and key to this market) is cognitive dissonance on trade duration. Can you maintain two opposing thoughts in your head at the same time and execute. Can you balance immediate-term trades vs longer term trends in your portfolio? Its not easy, otherwise everyone would do it (and many did back in 2020/21). I’ve been trading markets successfully for 20yrs, and when I say this is a tough market, it’s a tough market. Keep your balance and wits about you.
Coming up:
Tues Nov 1st: ISM Manufacturing, and API Energy report
Wed Nov 2nd: FOMC Meeting 1pm CST release, followed by Powell Press Conference 1:30pm CST
Thurs: Nov 3rd: Initial Jobless Claims
Fri: Nov 4th: US Non-Farm Payrolls/Employment data
All the best – JC
| John Caruso |
| Senior Market Strategist |
| Series 3 Licensed |
| Office: (312) 373-5286 |
| Toll Free: (800) 669-5354 |
| Fax: (312) 373-5278 |
