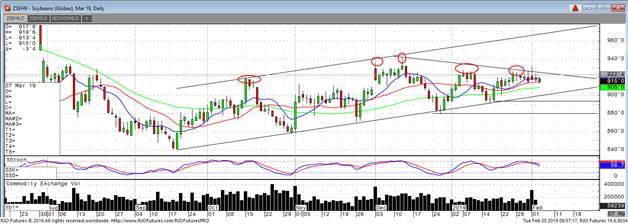
We are still looking at this options spread in March soybeans. There has been some time value that has bled out so it’s a little more expensive than when we were first getting into it but we still think it’s a good risk to reward. Looking at the March soybean chart below you can see the market has failed at the upper trend line multiple times. Bearish fundamentals with a large world ending stocks number and good production forecasts from South America will continue to pressure the market. This is also playing that we see no progress and/or agreement on U.S./China trade negotiations. With as much as the media has tried to spin good headline news on U.S./China trade, I believe the fundamentals will be the ultimate driver of the market. Support comes in at the lower trend line around 900 and then below that at 894 and 880. The second image has a chart with the green line representing the spread’s value at expiration.
If you would like to learn more about agricultural futures, please check out our free Fundamentals of Agricultural Futures Guide.
Soybeans Mar ’19 Daily Chart


