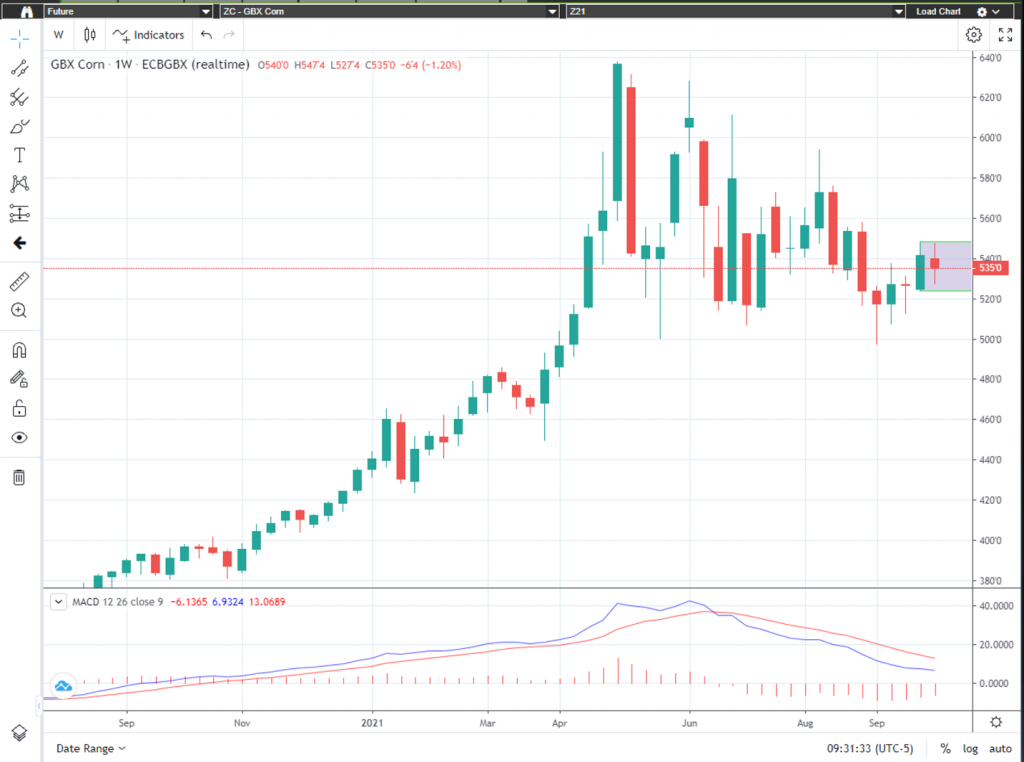
Three weeks ago, I advised traders on the following “Below is a weekly December corn chart, as one can see, this week December corn is trading inside last weeks price range. If it closes out the week this way (and I think it will) next week’s key short-term numbers to watch will be $5.38 ½ on the upside and $5.06 ½ on the downside. I would recommend traders take their cue from the breakout.” The was the week of September 20. Last week December corn broke above the $5.38 ½ level and moved to a high of $5.48 ½ before backing off and closing the week at $5.41 ½ – while we didn’t see corn make huge moves to the upside it was still a very solid showing for the week and more importantly confirmed the chart model I am following. This week is showing us another inside week setup. Traders should watch for a break above $5.49 or a break below $5.23, basically last week’s range. I am still cautiously bullish and believe Dec corn has additional upside if the fundamentals continue to remain in the range of estimates or come in bullish. On Tuesday October 12th USDA Supply Demand and Crop Production Reports will be released at 11am cst, make sure you have adequate risk management strategies in place to protect your positions as this market seems to be “coiling up”!
The “big picture” numbers remain the same and probably will for some time. I firmly believe a break below $4.96 could give the bears control of the market and a break above $6.39 ½ on the upside may have enough bulls behind it to propel corn to all-time highs. There are several minor areas of support and resistance inside this range that can help with short term market direction if violated. Call me directly at 1-800-367-7290 for more in-depth discussion on these numbers and to discuss trading strategies specific to your situation.
I would suggest using an option strategy to manage your futures position risk or an outright option strategy. Implied option volatility has come down quite a bit from its most recent highs mainly due to the consolidation and tighter trading ranges. I have 25 years of grain market experience, feel free to call or email with any questions you may have. Be sure to check out my archived weekly grain market insight articles posted on our website.
**** Reserve your FREE 2022 Commodity Trading Guide Today! ****
This 55-page guide is packed with indispensable market information. It has a complete commodity calendar listing all major market reports, option expiration dates, futures first notice dates, futures last trading dates, etc. It readily serves as your commodity market encyclopedia and has a market almanac for all regularly traded commodities. To reserve your copy today email me at msabo@rjofutures.com with your name, mailing address and a preferred contact number so we can confirm your information and I will have your copy reserved and ready to send out as soon as we receive them.