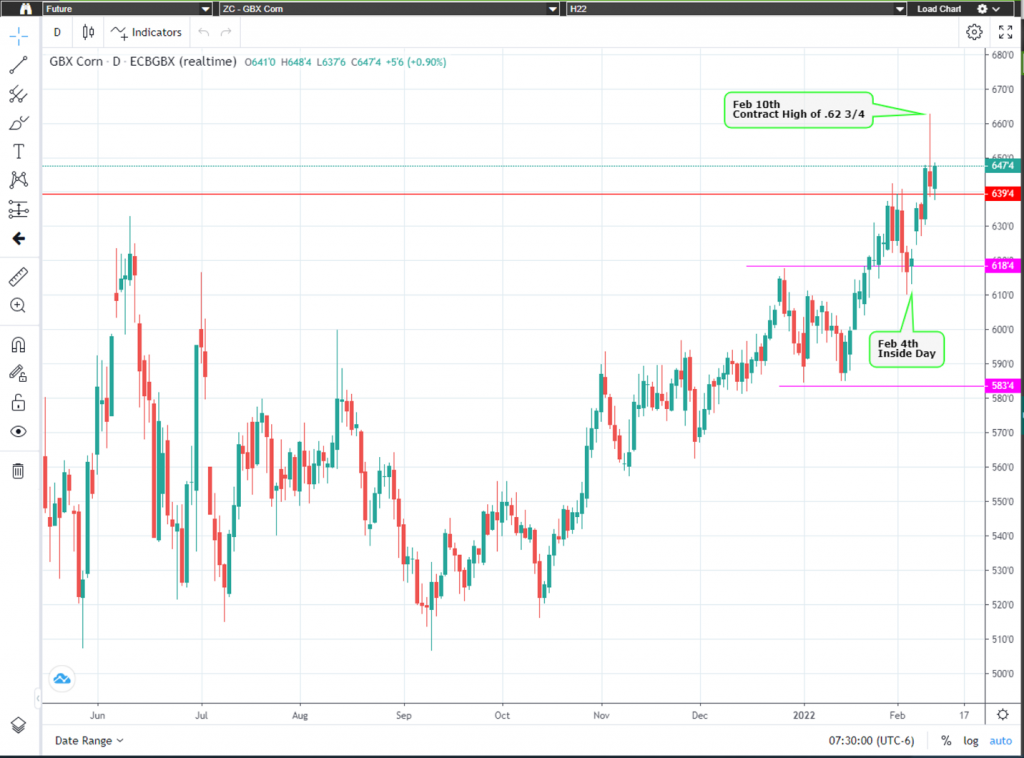
On February 4th I advised traders on the following: “As one can see by looking at the chart below on Jan 24th March corn broke out above $6.18 ½, a level I mentioned several times in my articles. By January 31st March corn reached a contract high of $6.42 ½ which took out another key level, in my opinion, of $6.39 ½ a level I have been advising on for months. With the small pullback to current trading / consolidation levels (inside day forming so far today). If today forms an inside day I would advise traders buying on a breakout above today’s high. I remain bullish for now, but traders should be prepared for additional volatility at these prices especially with the recent breakout.” Last Friday which was February 4th, the market did form an inside trading day as I thought it could (see chart below) on Monday the market broke out to the upside indicating a buy signal. I still remain bullish but would advise traders to be cautious as we could see short term selloffs to push the weak longs out of the market.
For months I have been advising traders on the following in my articles: “The “big picture” numbers remain the same and probably will for some time. I firmly believe a break below $4.96 could give the bears control of the market and a break above $6.39 ½ on the upside may have enough bulls behind it to propel corn to all-time highs.” FINALLY, after months of corn consolidating in a rather large trading range, March corn broke out above $6.39 ½, made a small pullback to a low of $6.10 ¼ and then quickly made a move to $6.62 ¾ on February 10th printing a new contract high! Call me directly at 1-800-367-7290 for more in-depth discussion on these numbers and to discuss trading strategies specific to your situation.
I would suggest using an option strategy to manage the risk on a futures position or a 3-legged option strategy for producers looking to forward market their grain. A strategy like this gives producers an opportunity to take advantage of further upside while protecting a sizable price area of downside risk. Implied option volatility is currently up, when compared to the historic volatility levels, so now may be an excellent time to implement strategies like this. Call for specific entry levels and strike prices. I have 26 years of grain trading experience, feel free to call or email with any questions you may have and be sure to check out my archived weekly grain market insight articles posted on our website.
**** Request your FREE 2022 Commodity Trading Guide Today! ****
This 55-page guide is packed with indispensable market information. It has a complete commodity calendar that lists the dates and times of Market Reports, option expiration dates, futures first notice dates, futures last trade dates, etc. It readily serves as your commodity market encyclopedia giving you an in depth look at each commodity, there is market almanac for all actively traded commodities and much more! To receive your complimentary Commodity Trading Guide, send me an email at msabo@rjofutures.com with the following information: your full name, mailing address and a preferred phone number so we can confirm your request. Once confirmed I will have it sent out.